Correcting misconceptions about load-management programs.
Lisa Wood is executive director of the Edison Foundation’s Institute for Electric Efficiency. Ahmad Faruqui is principal at the Brattle Group. The authors acknowledge the contributions of Sanem Sergici at the Brattle Group.
Clik here to view.
Clik here to view.
Clik here to view.

Clik here to view.
Clik here to view.
Clik here to view.
Studies are showing that dynamic electricity pricing—where prices vary based on system conditions, rising during critical periods for a few hours each year and falling during all other times—can benefit both customers and electric utilities alike. By encouraging customers to shift some of their demand on those critical days to off-peak hours, the higher peak prices can help utilities to defer the need for building additional capacity. And the lower off-peak prices represent a savings for consumers over their regular electric rate.
But how does dynamic pricing affect low-income customers who often are regarded as vulnerable? Different viewpoints yield different answers.1
One school of thought is that low-income customers, because they use relatively less energy than the typical residential customer, would benefit from a rate that charges them more during a few peak hours and less during the vast majority of other hours during the year. And, if low-income customers did shift some of their demand from peak to off-peak hours, they would benefit even more. Others believe that low-income customers would be harmed by dynamic pricing because they have little discretion in their power usage, which means they would have less to work with in terms of shifting demand to off-peak hours.
To learn more about how dynamic pricing might affect low-income customers, a recent IEE whitepaper examined some simulations involving dynamic pricing. It also reviewed the empirical evidence from some recent dynamic pricing programs. Before looking at the results, however, it’s important to have a clear understanding about what dynamic pricing is. The two types of dynamic pricing that have gained the most attention in the power industry and among state regulators are critical-peak pricing (CPP) and peak-time rebate (PTR).
CPP attempts to convey the true cost of power generation during the 100 to 200 hours each year—typically during the summer—when demand reaches its highest levels. In exchange for paying very high prices during those peak hours, customers receive a discounted rate for all remaining hours of the year. An alternative to the CPP rate is the PTR, which is a mirror image of the CPP rate.
Under a PTR, customers remain on their current flat rate but receive a cash rebate for each kilowatt hour (kWh) they lower their baseline usage during the peak hours. Under a PTR, customers who do respond can save money on their monthly bill. If they don’t lower their usage their monthly bill would stay the same.
The First Perspective
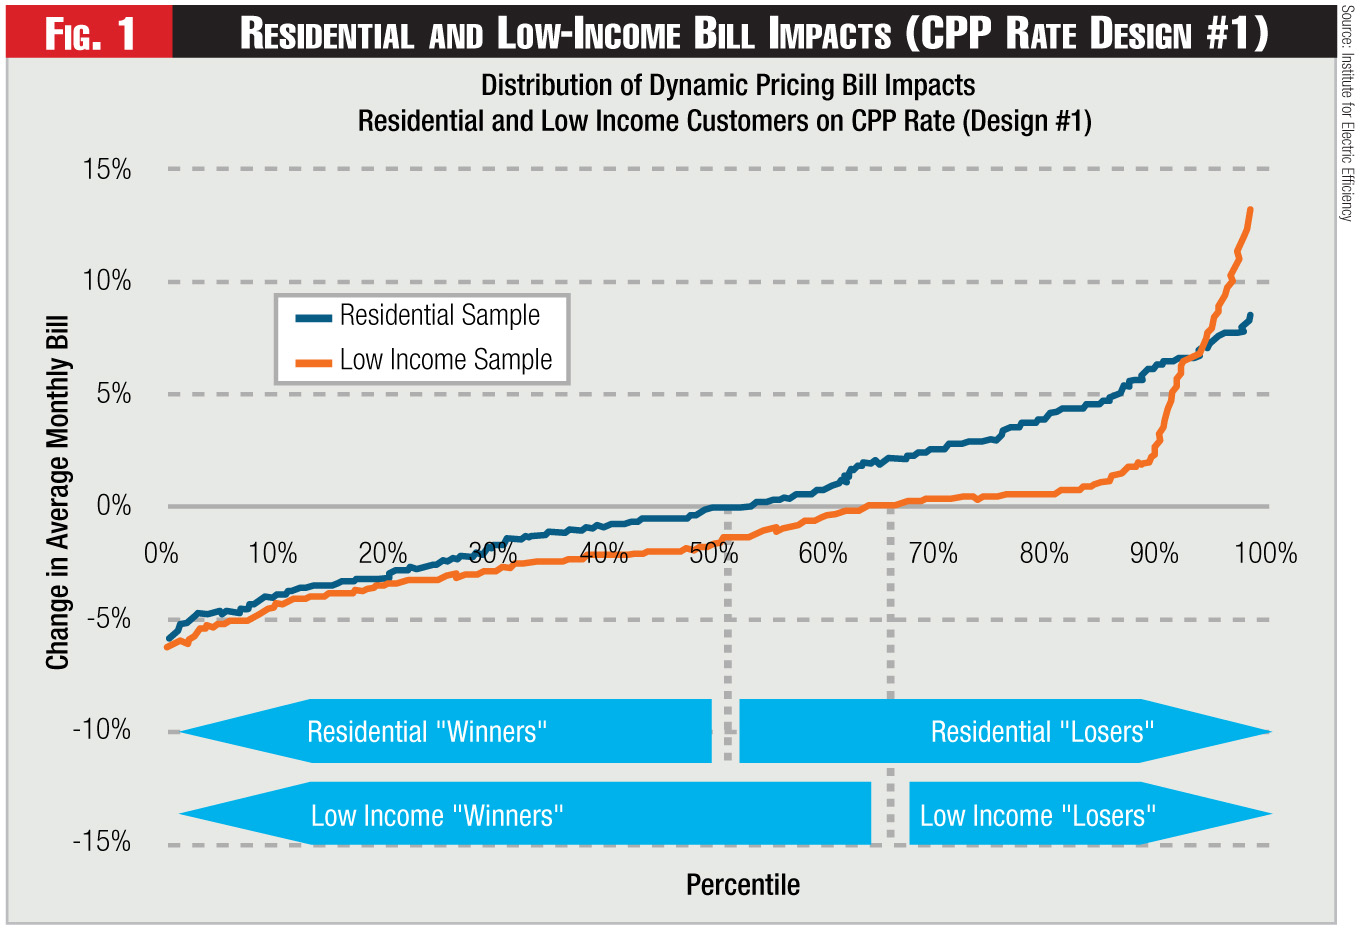
To examine the first issue—whether the relatively flat load-shape of the typical low-income customer would help or hurt them under a dynamic pricing program—the IEE paper simulated two versions of a CPP rate: CPP Rate Design #1 and CPP Rate Design #2. The simulations were conducted using representative samples of residential and residential low-income customers from a large, urban utility. Both of the CPP rates were designed to be revenue neutral relative to an existing rate of $0.13 per kWh.
• CPP Rate Design #1: The first CPP rate included a critical peak price of $1.25 per kWh during a four-hour peak period from 2 p.m. to 6 p.m. on fifteen critical days in the summer for a total of 60 hours. During the other 8,700 hours of the year, the rate is roughly $0.11 per kWh, which was $0.02 lower than the regular flat rate.
For a revenue-neutral dynamic-pricing rate such as this, it might be expected that half the customers in a utility’s service area immediately would see higher bills, and the other half immediately would see lower bills. And, when the rate is applied to the entire sample of customers, and assuming no change in usage patterns, that’s what happened.
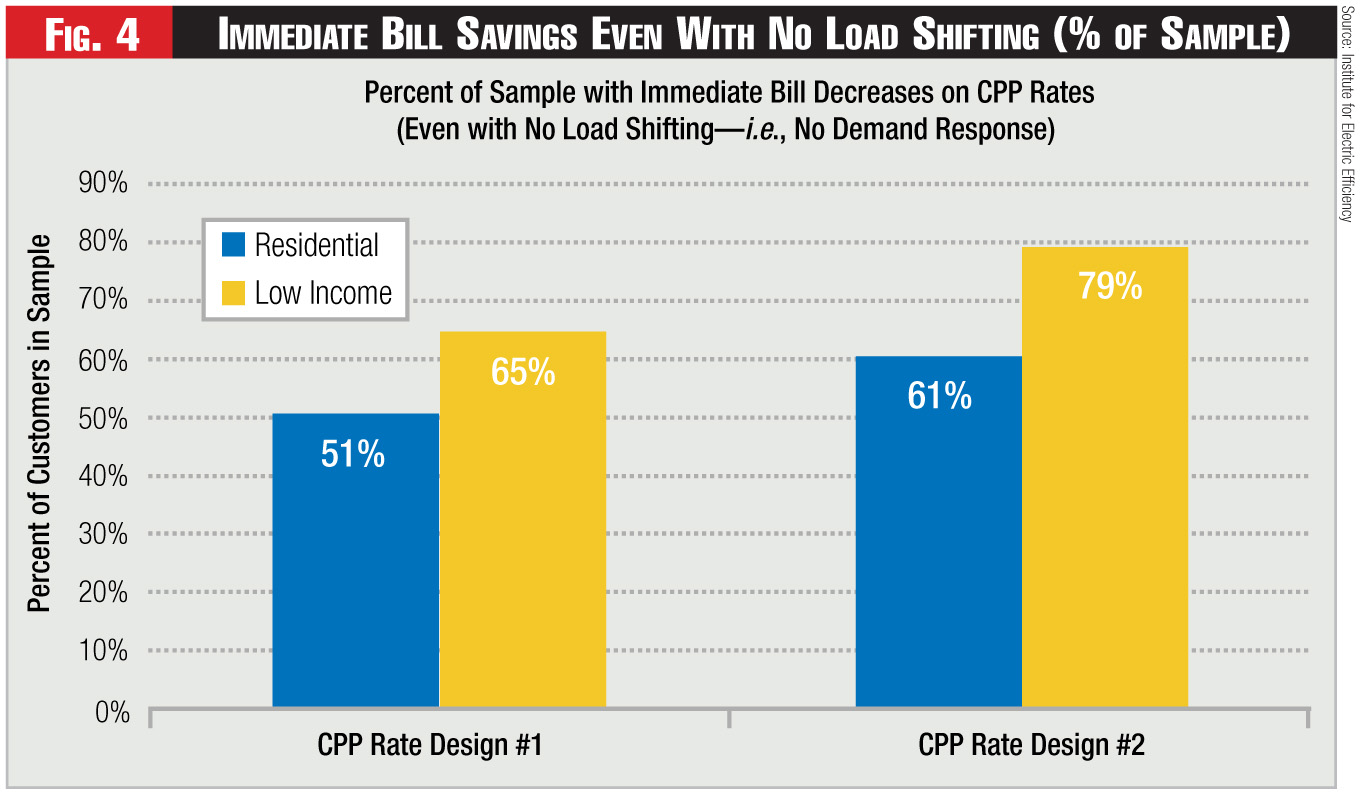
As indicated by the blue curve in Figure 1, about 50 percent experienced monthly bill decreases and about 50 percent experienced monthly bill increases under the dynamic rate. Next, the same computation was performed for just low-income customers. As shown again, roughly 65 percent of the low-income customers see their monthly bills decrease on the CPP rate, even without changing their usage pattern during peak periods. This can be attributed to their load shapes being flatter than the average customer’s.
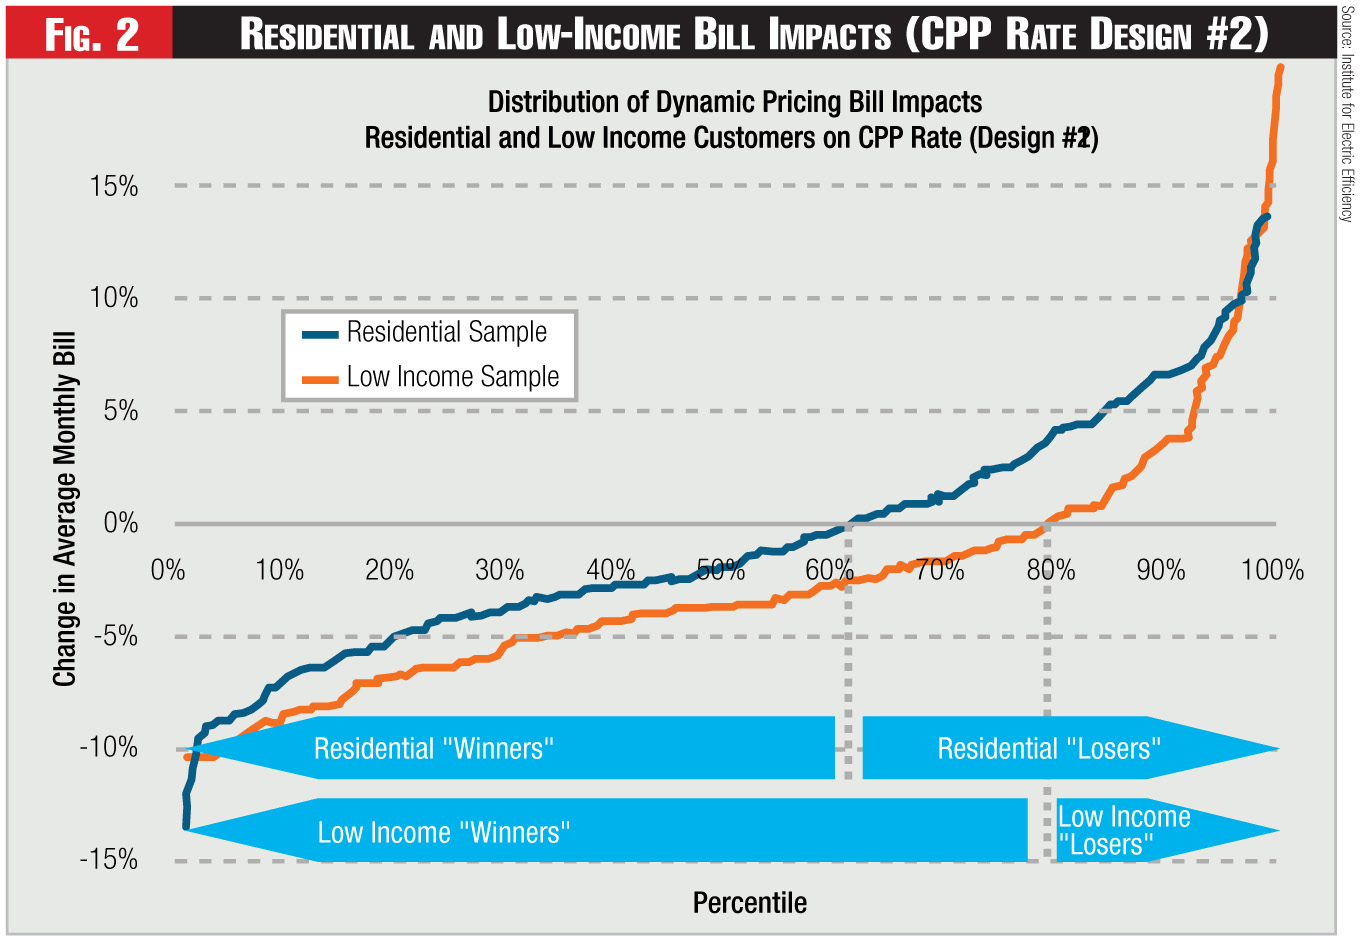
• CPP Rate Design #2: To test the sensitivity of these results, customer bills were re-computed using a second CPP rate, Rate Design #2. This rate applies only during the four summer months (i.e., June through September) and is seasonally revenue neutral.
The rate involved a critical peak rate of roughly $0.90 per kWh applied for a five-hour period from 2 p.m. to 7 p.m. during 15 critical summer days—i.e., about 75 hours between June 21 and September 21. The off-peak rate is $0.10 per kWh during the four summer months. During the other eight months of the year, the current flat rate of $0.13 per kWh is in effect.
Under this CPP rate (see Figure 2), about 60 percent of residential customers would realize monthly bill decreases even without shifting their usage.2 For low-income customers, nearly 80 percent are immediately better off and realize monthly bill decreases on this CPP rate even without shifting their usage.
The results of the simulations indicate that the percentage of low-income customers who will benefit from dynamic pricing by realizing lower monthly bills, even without shifting their usage, depends on the rate design itself. Overall, however, it’s highly likely that more than half of low-income customers immediately will benefit from a CPP rate even without shifting their usage.
The Second Perspective
To gain some insight on the second issue—how low-income customers respond to peak-pricing signals—the authors analyzed empirical evidence from four recent utility pilot pricing programs, and one full-scale pricing program.
The studies analyzed were: Baltimore Gas & Electric’s (BGE) Smart Energy Pricing Pilot; Connecticut Light & Power’s (CL&P) Plan-it Wise Energy Pilot; Pepco’s PowerCentsDC Pilot; the early results from a full-scale program that Pacific Gas & Electric Company (PG&E) is rolling out in northern and central California; and California’s widely cited Statewide Pricing Pilot, which ran from 2003 through 2005.
The results from each pilot or program are presented below. Note that these programs don’t share a uniform definition of low income.
• BGE Smart Energy Pricing (SEP) Pilot–Maryland: BGE conducted a Smart Energy Pricing (SEP) pilot program during the summer of 2008.3 In 2008, the SEP pilot included 1,375 residential customers of which 1,021 customers were placed on dynamic pricing rates and 354 customers formed a control group that stayed on their current rates. BGE also tested the impacts of two different technologies, the Energy Orb, and a switch for cycling air conditioners, in conjunction with the dynamic-pricing options.
The pilot tested three dynamic-pricing structures: a dynamic peak-pricing (DPP) tariff, a low peak time rebate (PTRL), and a high peak time rebate (PTRH). The DPP rate consisted of a critical peak rate of $1.30 per kWh, peak rate of $0.14 per kWh, and an off-peak rate of $0.09 per kWh. There were 12 critical days called during the pilot period, and the critical hours were between 2 p.m. and 7 p.m.
With both the low and high PTR, customers remained on their existing rate of $0.15 per kWh. However, during critical peak hours from 2 p.m. to 7 p.m. on the 12 critical days, customers received a rebate of $1.16 per kWh (low) or $1.75 per kWh (high) for reducing their consumption below their baseline amount.4
For the BGE analysis, a customer with an income level less than $25,000 was defined to be a low-income customer, generally in line with the federal poverty threshold. This choice for the low-income threshold was based on the income question in the enrollment survey.
For the full sample of customers, the peak reductions varied across programs and enabling technologies. In the absence of enabling technologies, the peak reduction was 18 to 21 percent. With the Energy Orb, the peak reduction ranged from 23 to 27 percent. With both the Energy Orb and a switch on the central air conditioner, the peak reduction ranged from 28 to 33 percent. As expected, enabling technologies resulted in increased price response.
Within the subset of customers with known income status (1,007 of the 1,375), the paper defined two groups: low-income, which had a self-reported income of under $25,000; and high-income, with a self-reported income of over $75,000.
The results show that a customer’s income status didn’t have a measurable effect on price responsiveness. In other words, the price responsiveness of low-income customers wasn’t statistically different from that of higher income customers.
• CL&P Plan-it Wise Energy Pilot–Connecticut: CL&P conducted its Plan-it Wise Energy Pilot in the summer of 2009. The pilot included 1,251 residential customers, of whom 1,114 customers were placed on dynamic pricing rates and 137 customers formed a control group that stayed on their current rate.
Plan-it Wise tested three different rate structures (see Figure 3): time of use (TOU), peak time pricing (PTP), and peak time rebate (PTR), each with two different price levels (low and high). A total of 10 critical event days were called over the course of the pilot for the PTR and the PTP rates. The TOU rate was in effect on weekdays from June through August.
The peak period was defined as between 2 p.m. and 5 p.m. for PTR and PTP, and between 12 noon to 7 p.m. for the TOU rate. The pilot also tested several different technologies including smart thermostats, A/C switches, Energy Orbs, and in-home displays in combination with the time-based rates.
Two different definitions of low-income customers were used for the purposes of this analysis. The first definition was based on the income question in the program enrollment survey, in which a customer was defined to be low income if annual income was less than $50,000. The second definition was based on a customer being certified by the state as a hardship customer.
The results were analyzed for the full sample and weather normalized. The PTP rate had the greatest impact, resulting in up to 29-percent peak reduction, while the TOU rates had the lowest impacts, between 2- and 4-percent peak reduction. As expected, the higher rates under the PTP and PTR led to greater peak impacts.
As with BGE, obtaining results for different income levels was more complicated. Only 552 out of 1,251 customers responded to the income question on the survey. However, within the subset of customers who did respond to the income question, the degree of price responsiveness for low-income customers was about the same as for the average customer.
Using the second definition of low income—hardship—the results were slightly different. In this case, results indicated that hardship customers responded slightly less than the average customer to the PTP rate. The incremental effect of the PTR rate was similar for hardship and non-hardship customers. Average customers responded to the high PTP rate with a 20-percent peak reduction, and hardship customers responded with an approximate 13-percent reduction.5
• Pepco PowerCentsDC Pilot– District of Columbia: Pepco DC administered its PowerCentsDC pilot from July 2008 to February 2009. The pilot involved nearly 900 treatment and 400 control-group customers. One unique feature of the PowerCentsDC program is that it actively recruited a group of low-income customers to understand their responsiveness to dynamic pricing. All program participants randomly were selected and then asked to participate in the program.
Three rate designs were tested in the pilot: CPP, critical-peak rebate (CPR) (which is the same as PTR), and hourly pricing (HP). The critical-peak period was from 2 p.m. to 6 p.m. on weekdays. Customers with central air conditioners also were offered a smart thermostat. Customers who had Pepco’s residential aid discount (RAD) status were defined as low-income customers. Under the program design, low-income participants only could be placed on the CPR, not the CPP rate. According to Pepco’s PowerCents DC September 2010 report, low-income customers on the CPR were slightly less responsive than the higher-income customers.6 The results indicate that low-income customers on the CPR exhibited 11-percent peak reduction, while the higher-income customers reduced their peak loads by 13 percent.
• PG&E SmartRate Tariff–California: PG&E deployed the first large-scale CPP program in North America directed at residential customers in the summer of 2008 for the six months May through October. The SmartRate tariff initially was offered to residential (E-1 and E-8) and non-residential (A-1) customers in the Central Valley town of Bakersfield and the greater Kern County region, which lies in the southern-most portion of its service area. The SmartRate program was offered again in 2009. By the end of summer 2009, the program had roughly 25,000 active participants. Results for both 2008 and 2009 are reported below.
The SmartRate price was layered on top of PG&E’s default tariff. For residential customers, the incremental charge of $0.60 per kWh applied during critical hours on SmartDays, and a credit of about $0.03 per kWh applied to all other hours to maintain revenue neutrality.
Up to 15 SmartDays could be called over the course of the summer; in 2008, nine SmartDays were called. The critical peak period was from 2 p.m. to 7 p.m. The incremental charge and credits were layered on top of the existing 5-Tier inclining block rate tariff.
Low-income customers are designated as those who qualify for California Alternate Rates for Energy (CARE), a program in which low-income customers receive substantially discounted rates.
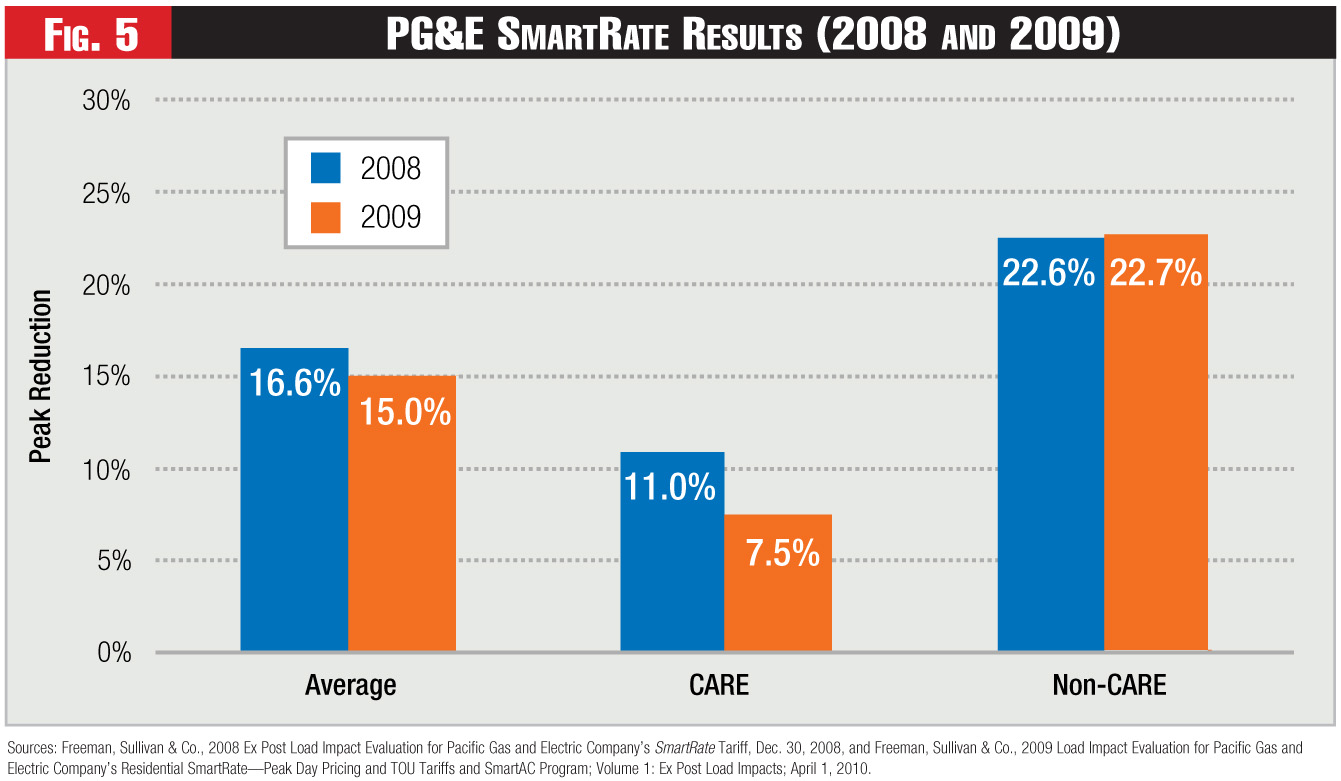
In 2008, the average residential customer across the nine SmartDays reduced peak load by 16.6 percent; CARE customers reduced peak load by 11 percent; and, non-CARE by 22.6 percent on average (see Figure 5). Hence, the response of low-income customers was lower than that of the higher income customers, but still sizable.
In 2009, the average CARE peak reduction was 7.5 percent and the average non-CARE peak reduction at 22.7 percent, with an overall average customer response of 15 percent. Thus, the CARE customers in 2008 responded half as much as non-CARE customers, while in 2009 they responded one-third as much.
• California Statewide Pricing Pilot (SPP): In 2003, California initiated its Statewide Pricing Pilot (SPP) to help quantify demand response to dynamic pricing. The SPP included approximately 2,500 residential and small commercial and industrial customers and tested several different time-varying rates during the following three years. Although this pilot now is several years old, it’s included because the results are widely cited and remain relevant.
The rates included a TOU rate, in which the peak to off-peak price ratio was roughly 2:1 and a CPP tariff, in which the critical peak to off-peak ratio was 6:1. The CPP-F rate had a fixed critical-peak period and day-ahead notification. Similar to the PG&E Smart-Rate program, the peak period was from 2 p.m. to 7 p.m.
The experiment was divided into three tracks, two of which are relevant. Track A was designed to be representative of California’s general population. And Track B was designed to be representative of the members of a low-income community in San Francisco. Track A was spread over four climate zones in California, and Track B focused on a single climate zone.
Track A yielded results on two categories of low-income customers. First, snapshots of low-income and high-income customers were compared, with low-income customers having an average income of $40,000, and high-income having an average income of $100,000. Second, the price responsiveness of customers on the state’s CARE program, who receive a discount on their electricity bill, was compared with the responsiveness of non-CARE customers.
Overall, high-income households were somewhat more price-responsive than low-income households; however, the difference wasn’t substantial.
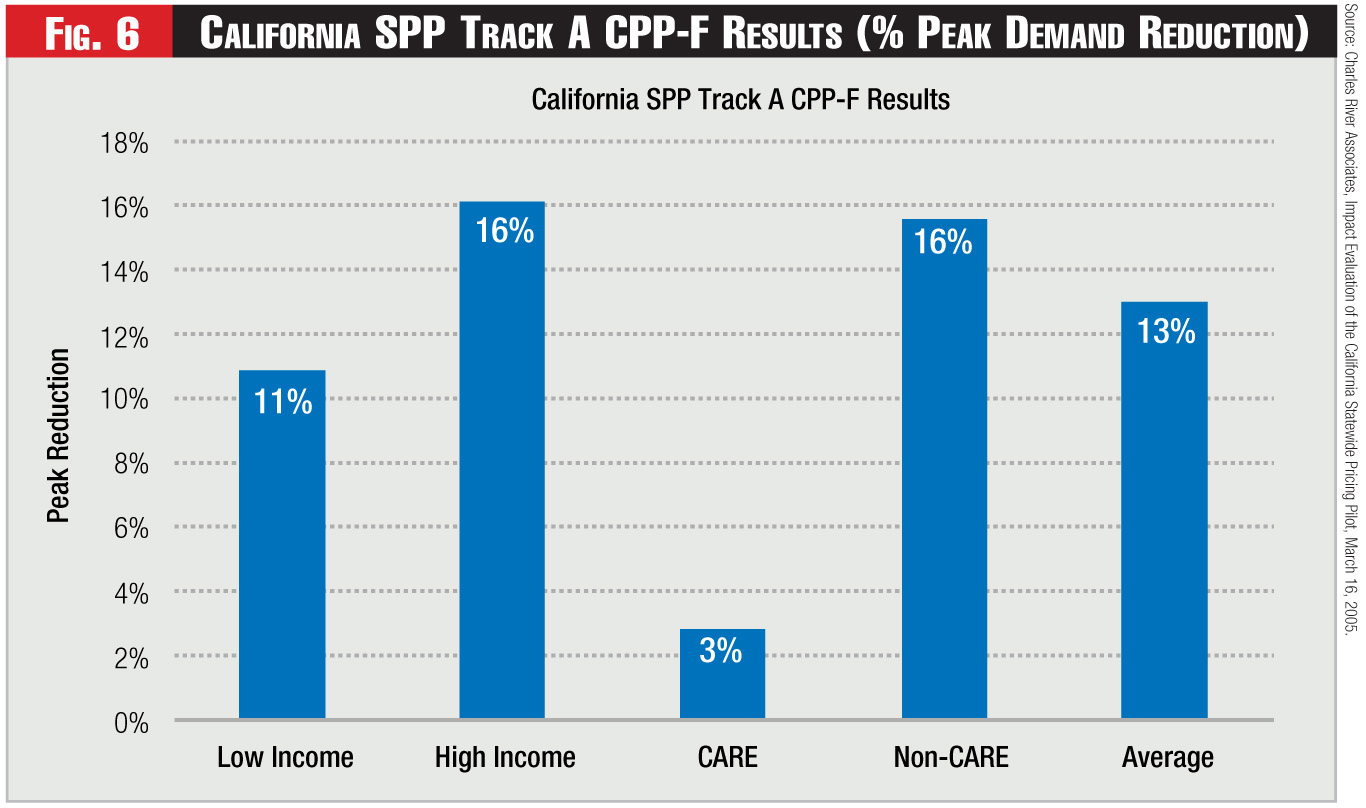
Track A compared the peak demand reductions of low-income ($40,000) and high-income ($100,000) customers, as well as CARE vs. non-CARE customers. Customers with average incomes of $100,000 exhibited average peak reductions of 16 percent on the CPP-F rate, while customers with average incomes of $40,000 exhibited average peak reductions of 11 percent (see Figure 6). Similarly, non-CARE customers exhibited average peak reductions of 16 percent while CARE customers exhibited peak reductions averaging 3 percent.
Within Track B, designed to be representative of the low-income community, customers that received only information reduced peak demand by 1.15 percent, while those that were also placed on the CPP-F rate reduced peak demand by 2.6 percent.
Dynamic Pricing Evaluation
In several pilots and programs that utilities have performed, low-income customers did respond to dynamic rates, and many such customers benefitted even without shifting load. Consequently, when evaluating dynamic pricing, it’s important to recognize that such rates may be beneficial to a large percentage of low-income customers.
While there’s mixed evidence on the magnitude of the responsiveness of low-income customers relative to other customers, there’s strong evidence across these five programs that low-income customers do respond to dynamic rates and, in many cases, that response is a load reduction exceeding 10 percent.
Furthermore, even without responding to dynamic rates, a large percentage of low-income customers will be immediate beneficiaries of dynamic rates due to their flatter-than-average load profiles. Finally, restricting access to dynamic rates may, in fact, be harmful to a large percentage of low-income customers.
Endnotes:
1. See the white paper, “The Impact of Dynamic Pricing on Low Income Customers,” posted on the Web site of the Institute of Electric Efficiency: http://www.edisonfoundation.net/iee/reports/index.htm.
2. In this sample, smaller customers tended to have flatter load shapes, and therefore also tended to experience immediate bill decreases. So, for the sample as a whole, the revenue change was close to zero, even though there were more winners than losers.
3. Another Smart Energy Pricing pilot was carried out in summer 2009, but there are no separate low-income results from the 2009 analysis.
4. In this pilot, the baseline was calculated by identifying ten non-event non-holiday weekdays preceding an event day, choosing the three highest kWh days while omitting any days not within 10 percent of the THI for the event day, and using these remaining days to calculate an average 24-hour load profile for each PTR customer.
5. In this case of hardship, comparisons were made based on treatment customers only, since there were no control customers with hardship status.
6. Although preliminary results from the Wolak paper, An Experimental Comparison of Critical Peak and Hourly Pricing: The PowerCents DC Program, March 2010, showed that low-income customers were more responsive than higher-income customers, the final results show the responses of low-income customers to be similar but slightly lower than higher-income customers (see PowerCentsDC Program Final Report, September 2010).
Category (Actual):
Department:
Clik here to view.
