Evaluating the impact of dynamic pricing.
Trevor R. Roycroft, PhD, is an independent consultant providing economic and policy research and analysis. Email him at trevor@roycroftconsulting.org.
Dynamic pricing will expose retail consumers to new opportunities and challenges in electric power markets. The impact of dynamic pricing on low-income consumers deserves special attention as low-income populations have different load profiles, resulting in different abilities to respond to price signals as compared to higher income households.
In the November 2010 Fortnightly article “Dynamic Pricing and Low-Income Customers” by Lisa Wood and Ahmad Faruqui (the “Wood/Faruqui article”), the authors conclude that low-income customers have much to gain from dynamic pricing.1 Given the challenge of transitioning low-income consumers into dynamic pricing, the support for this conclusion deserves full evaluation.
When considering the impact of dynamic pricing on low-income consumers, the term “low income” must be carefully defined. While the Wood/Faruqui article reports information for verified2 low-income consumers associated with some of the studies, it also designates other income categories associated with some pilots as “low income” (even if the pilot has a verified low-income component). Juxtaposing results from verified low-income customers with customers who fall into an arbitrarily defined lower income category is likely to result in households that aren’t subject to financial hardship to be counted as “low income.”
Income levels alone aren’t sufficient to identify households with financial hardship or poverty; family size and composition contribute to a proper definition of “low income.” For example, a household with annual income of $40,000 and one member will have a very different financial profile than a household at the same income level with four members. The Wood/Faruqui analysis doesn’t always make this distinction, and as a result is more likely to find that “high-” and “low- income” customers have similar pricing responses.
Review of Empirical Data
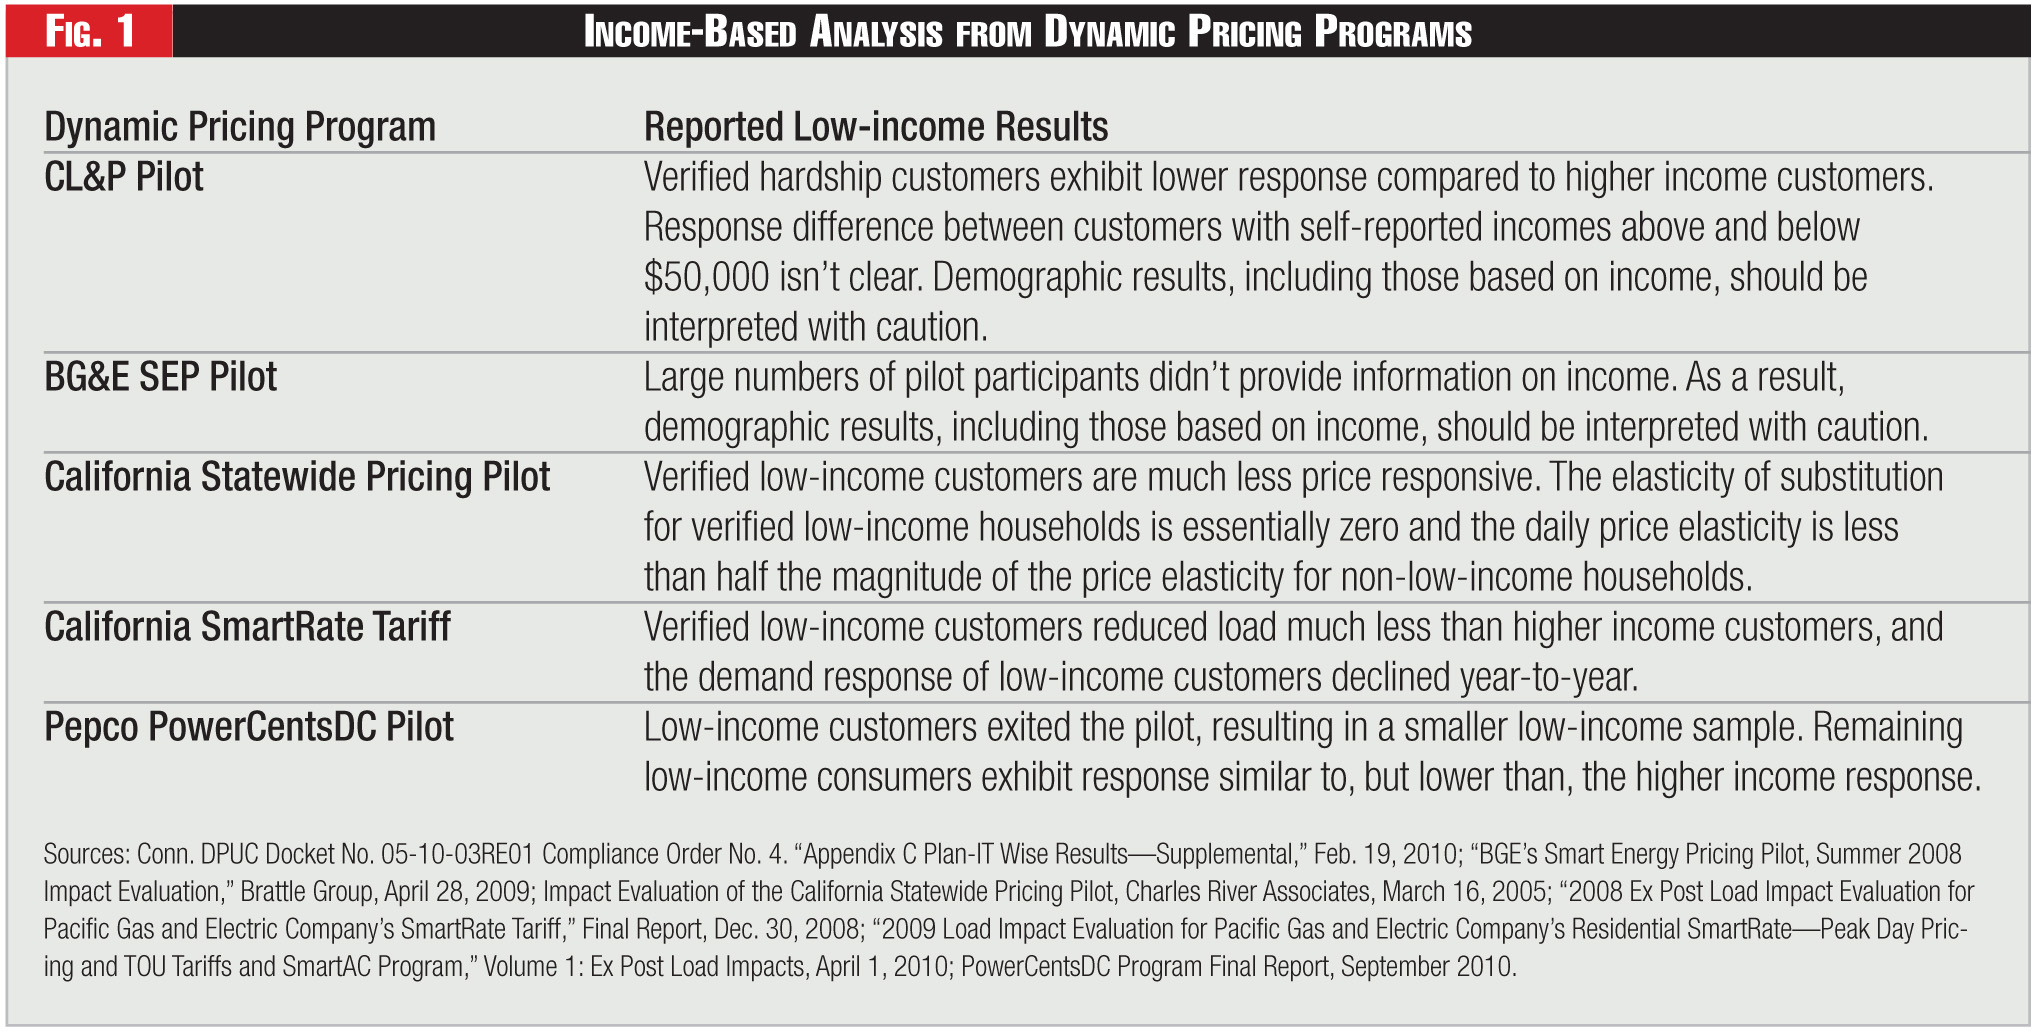
The Wood/Faruqui article reviews information from four dynamic pricing pilot programs and one dynamic pricing tariff. Each of these programs has been previously evaluated in reports filed with public utility commissions. However, these previous reports indicate that the low-income dynamic pricing response is either not clear or shows a more limited response than higher-income consumers (see Figure 1). The Wood/Faruqui article reevaluates these programs and arrives at a different conclusion—that low-income customers do respond to dynamic rates, and many low-income customers benefitted even without shifting load. It’s important to understand the difference in perspective regarding the potential pricing response of low-income consumers.
The Connecticut Light & Power (CL&P) Plan-It Wise energy pilot illustrates a significant problem with research regarding low-income consumers; consumers are often reluctant to reveal their income level, resulting in missing data. In the CL&P pilot, 44.1 percent of participants declined to state their income levels. While the Wood/Faruqui article states that price responsiveness of the customers who did respond to the income question is about the same as the average customer, because of the missing data problem this conclusion isn’t convincing.
The CL&P pilot also illustrates the importance of income classifications. To determine the income status of pilot participants, CL&P conducted enrollment surveys. For those who responded, the enrollment survey divided participants into one of four income categories, with “less than $50,000” being the lowest. The Wood/Faruqui article treats the “less than $50,000” classification as “low income.” However, the “less than $50,000” category might contain households that aren’t facing financial hardship, e.g., a single professional. These households can’t be expected to respond to dynamic pricing in the same manner as, for example, a family of five.
The impact of missing data on interpreting income-related responsiveness in the CL&P pilot is elsewhere acknowledged by one of the Wood/Faruqui article’s authors. In a document filed with the Connecticut Department of Public Utility Control on Feb. 19, 2010, Dr. Faruqui described a regression evaluation of the socio-demographic factors associated with the CL&P Plan-IT Wise pilot:
Furthermore, the Feb. 19, 2010 report concluded that the difference in price response of customers with incomes above and below $50,000 was “not clear.”
CL&P also separately identified a portion of the pilot population as low-income/hardship customers. With regard to these hardship customers, the Wood/Faruqui article states: “[R]esults indicated that hardship customers responded slightly less than the average treatment customer to the PTP rate, although they did still respond. The incremental effect of the PTR rate was similar for hardship and non-hardship customers.”
However, the Feb. 19, 2010 report states that hardship customers were “non-responsive” for time-of-use (TOU) rates. The evaluation of the CL&P hardship cases led the Feb. 19, 2010 report to conclude that “hardship reduces responsiveness.”
When considering the Baltimore Gas & Electric Smart Energy Pricing (SEP) pilot, the Wood/Faruqui article claims that the elasticity of substitution of low-income customers isn’t statistically different from that of higher income customers. However, because the data set associated with the SEP pilot couldn’t determine the income levels of about 27 percent of pilot participants, the Wood/Faruqui article bases its conclusion on a biased subset of data from a customer survey.4 Faruqui acknowledged the data’s incomplete nature when he prepared an assessment of the BGE SEP Pilot for Baltimore Gas & Electric:
This again highlights the difficulty of projecting the impact of dynamic pricing on low-income customers—consumers are hesitant to report income levels in surveys. This hesitancy leads to missing data and undermines statistical validity of results. This problem points to the importance of studying the behavior of verified low-income consumers.
Selection Bias
The California Statewide Pricing Pilot (CSPP) was conducted in 2003. With regard to the income characteristics of customers in the CSPP, the Wood/Faruqui article states: “Overall, high-income households were somewhat more price-responsive than low-income households; however, the difference wasn’t substantial.”
However, a review of the CSPP points to some problems with the underlying data and to verified low-income customers who are less responsive.
The CSPP had three “tracks.” The CSPP’s Track A included an analysis based on customer income. However, according to the Charles River Associates report filed with the California Commission on the CSPP, the Track A component of the CSPP took a selective approach to developing its sample population and reflected the following customer characteristics:
As a result, the Track A pilot suffers from sample bias, and doesn’t provide a reasonable platform for making generalizations. Generalizing to a larger population from information generated from a biased sample won’t result in reasonable projections.
In addition, as was the case with the CL&P pilot, the Wood/Faruqui article arbitrarily treats a lower income classification associated with the CSPP as “low income.” In the Charles River report, the results of the CSPP were evaluated in part by grouping participants into two income classifications—those with “average annual income equal to $100,000” and those with “average annual income equal to $40,000.” Here too, the Wood/Faruqui article defines the lower income threshold as “low income” and reports its conclusions as if all customers in the lower income classification are verified low-income customers. However, the “lower” income group could have many households that don’t exhibit hardship.
The CSPP also studied customers that were enrolled in the state’s CARE program. The CARE program provides energy assistance to qualified low-income customers. Given the income qualification of the CARE customers, the results relating to the CARE program are important to consider. The Charles River report on the CSPP summarizes as follows regarding the CARE program participants:
Thus, according to the Charles River report, the true low-income customers studied in the CSPP are much less price responsive. The Wood/Faruqui article’s conclusion that the CSPP shows that high and low-income customers don’t exhibit a “substantial” difference isn’t consistent with the data from verified low-income consumers.
Similarly, evaluation of the PG&E SmartRate Tariff program has found the participating low-income customers in the CARE program to be much less demand-responsive than non-CARE customers. The 2009 report on the SmartRate tariff, prepared by Freeman, Sullivan & Co., concludes:
The 2010 Freeman, Sullivan & Co. report states:
The year-to-year decline in low-income CARE customer response is also important to note—CARE customer response declined from 11 percent in 2008 to 7.5 percent in 2009, while non-CARE customers’ response was unchanged. The persistence of customer response to dynamic pricing among low-income consumers is important to the long-term success of the programs and may need to be addressed in the design of dynamic pricing programs.
Further, in analyzing the Pepco PowerCentsDC pilot, the Wood/Faruqui article correctly notes that the observed response of low-income customers is lower than high-income customers. However, the underlying data appears to be less than ideal. The final report on the Pepco PowerCentsDC Program states:
Thus, the inclusion of low-income consumers in the Pepco pilot ran into problems, and low-income representation was less than planned. The Pepco pilot also illustrates the policy problem of incorporating a more transitory low-income population into a dynamic pricing program.
Winners and Losers
The Wood/Faruqui article states that it simulates the impact on the average monthly bill from the implementation of critical peak pricing (CPP), and concludes that more than half of low-income consumers will benefit immediately from CPP rates.
Some detail regarding the nature of the samples of residential and residential low-income customers used in the simulations would be informative. For example, it isn’t clear whether the data is drawn from a pilot or general billing records; how the “low-income” classification was developed; or the number of residential accounts sampled.10
The Wood/Faruqui article also assumes that these pricing plans can be implemented at no cost to ratepayers. It seems unlikely that ratepayers will have the ability to participate in CPP rates without paying for smart meters. The costs of smart meters must be recovered, and will reflect in customer bills. Thus, claims regarding the benefits of CPP plans for low-income customers aren’t well supported. A more reasonable interpretation of “winners and losers” arising from CPP plans must include the impact of the cost of enabling the CPP plans on customer bills, including the cost of smart meters.
A key component of the “smart grid transformation” is the response that policy makers can expect from price signals sent to consumers. It’s reasonable to expect that consumers with higher incomes will have load to shed during peak periods; higher-income households are more likely to have central air conditioning, pool or spa pumps, dishwashers, washers and dryers, etc., than are low-income households. The ability to shed load opens the possibility for both customer savings and social benefits from peak demand reduction. However, the level of benefits available for low-income consumers is another matter. A lower potential consumer pricing response might provide fewer benefits to offset the costs of implementing dynamic pricing.
The limited information that is available from programs such as those at CL&P, BGE, Pepco and PG&E shows that low-income customers exhibit a reduced ability to benefit from dynamic pricing, and points to characteristics of low-income households, such as more frequent moves, that should be addressed in dynamic pricing and demand response programs. Policy makers should be sensitive to the position in which low-income consumers are likely to find themselves when confronting the transition to the smart grid—a limited ability to respond to market incentives, which will likely limit the benefits available. Safeguards should be built into dynamic pricing programs to counter low-income customers’ more limited ability to capture benefits from dynamic pricing.
(Lisa Wood and Ahmad Faruqui respond to this article here.)
Endnotes:
1. The Wood/Faruqui article presents analysis from a September 2010 white paper published by the Institute for Electric Efficiency titled “The Impact of Dynamic Pricing on Low Income Customers.” This response to the Wood/Faruqui article also applies to the IEE Whitepaper.
2. “Verified” in the sense that pilot participants were associated with a low-income energy assistance program or otherwise associated with poverty status.
3. Conn. DPUC Docket No. 05-10-03RE01 Compliance Order No. 4. “Appendix C Plan-IT Wise Results—Supplemental. Analysis by the Brattle Group,” Ahmad Faruqui, PhD, and Sanem Sergici, PhD, February 19, 2010.
4. The IEE Whitepaper (p. 16) also states that the subset of participants for which income data is known exhibits a higher level of demand response than the overall pilot population, indicating sample bias.
5. Ahmad Faruqui, PhD, and Sanem Sergici, PhD, “BGE’s Smart Energy Pricing Pilot, Summer 2008 Impact Evaluation,” Brattle Group. Prepared for Baltimore Gas & Electric. April 28, 2009, p. 18.
6. Impact Evaluation of the California Statewide Pricing Pilot, Charles River Associates, March 16, 2005, p. 9.
7. “2008 Ex Post Load Impact Evaluation for Pacific Gas and Electric Company’s SmartRate Tariff,” Final Report, Dec. 30, 2008, pp. 34-35.
8. “2009 Load Impact Evaluation for Pacific Gas and Electric Company’s Residential SmartRate —Peak Day Pricing and TOU Tariffs and SmartAC Program,” Volume 1: Ex Post Load Impacts, April 1, 2010, p. 35.
9. PowerCentsDC Program Final Report, September 2010, p. 18.
10. This information is also not provided in the related IEE white paper.
Category (Actual):