The changing architecture of demand response in America.
Ahmad Faruqui, Ryan Hledik and Sanem Sergici are economists with The Brattle Group. Faruqui (ahmad.faruqui@brattle.com) led the multi-company research team (including Brattle Group, Freeman, Sullivan and Co., and Global Energy Partners) that produced the FERC assessment cited in this article. The authors acknowledge research assistance from Lamine Akaba and Jennifer Palmer.
There is universal agreement that demand response (DR) should play an important role in meeting America’s energy needs. And total disagreement on the nature of this role. Two key questions continue to be debated with much vigor in regulatory proceedings before state commissions and in executive boardrooms. First, how big of a role can DR play in meeting future energy needs? And second, what should be the mix of programs in the DR portfolio?
With a view to advancing this debate, the authors present the key findings from a comprehensive assessment of the potential for DR that was submitted by the Federal Energy Regulatory Commission (FERC) to Congress last year. Evidence points toward a major shift in both restructured and regulated states toward dynamic pricing programs. This shift might change the architecture of DR in the country. But before this change can take place, several barriers need to be overcome. Scientific experimentation can play a salient role in this endeavor. However, while many experiments have been conducted and provide significant insights into customer behavior, the results might not be transferable to other regions. There will be an ongoing need for experimentation to guide the development of appropriate public policies and to address customer and regulatory concerns that are unique to each geography.
FERC Assessment
A report filed by FERC with Congress last June stated that existing DR programs in the United States have the capacity to offset 4 percent of current U.S. peak demand.1 The existing crop of programs is dominated by traditional, reliability-driven programs such as direct control of end-use loads including residential air conditioning and curtailable and interruptible rates for large commercial and industrial customers.2 These programs have a long history going back half a century.
There is considerable geographical variation in the amount of DR, largely driven by such factors as the rate of load growth, the cost of avoided capacity and the regulatory disposition toward demand-side programs. Some areas, such as California, Florida and New England, have significant DR activity while others, such as Alaska, Montana and Wyoming, have little.
If this level of DR is preserved through the next decade, the FERC report states that DR would shave 38,000 MW off U.S. peak demand in 2019. The report further states that if the existing mix of programs expanded geographically to include regions that currently have little DR activity and if customer participation rates in every region were to reach the levels representing today’s best industry practices, the potential impact of DR programs would be significantly higher, reaching 82,000 MW, or 9 percent of U.S. peak demand.
In October, the U.S. Department of Energy (DOE) issued 100 awards totaling $3.4 billion to stimulate the development of the smart grid.3 The awards, chosen from a list of some 400 proposals, encompass a variety of projects. But, in a break from past federal government awards, which have tended to be exclusively technology-focused, the awards also feature innovative rate design practices, such as dynamic pricing, that would promote the acceptance of DR by customers.
In these awards, DOE allocated $1 billion to empowering consumers to save energy and cut utility bills. The DOE announcement noted, “These investments will create the infrastructure and expand access to smart meters and customer systems so that consumers will be able to access dynamic pricing information and have the ability to save money by programming smart appliances and equipment to run when rates are lowest. This will help reduce energy bills for everyone by helping drive down ‘peak demand’ and limiting the need for ‘stand-by’ power plants—the most expensive power generation there is.” 4
As dynamic pricing practices gain favor with customers, they likely will receive active consideration from the state regulators who would ultimately have to approve their deployment.
One could argue that the Obama administration has brought dynamic pricing to a tipping point by making it a key element of the smart-grid stimulus package. But other factors are working in the same direction.
Dynamic pricing is receiving active consideration by independent system operators (ISOs) and regional transmission organizations (RTOs). The theme of the third DR symposium organized by the PJM Interconnection in Baltimore in November 2009 was price-responsive demand, which involves bidding negatively sloping demand curves into the wholesale market.5 Currently, PJM with a peak demand of some 140,000 MW, has about 7,000 MW of DR resources in place. Almost all of these rely on traditional program designs and involve bidding so-called “negawatts” into the wholesale market. PJM is hoping that price responsive demand will put “demand-side resources back on the demand side of the equation.”
Terry Boston, PJM’s president and CEO, issued a statement saying that PJM’s long-term vision was price responsive demand, since it allows customers to respond directly to market prices. He sought out the assistance of state regulators to:
[T]ake advantage of price responsive demand capabilities through their own retail rate structure. To grow demand response and establish its participation as an enduring feature of PJM markets, our region needs innovative retail rates that are linked to wholesale prices. PJM’s market is well-suited to facilitate such demand participation because it already provides transparent price information at each location that is consistent with grid reliability requirements. PJM will embark on a program to encourage individual States to promptly design their own dynamic rate structure—in whatever way that best serves their own State. PJM is willing and able to support various retail rate structures with tools and systems that enable customer response to real-time wholesale prices and recognize demand response capabilities in reliable grid operations, transmission planning and capacity adequacy planning.6
The idea of introducing price elasticity into retail markets also is gaining currency at ISO New England and the New York ISO, and has been discussed at their stakeholder meetings. It also has been discussed by the Supply Adequacy Working Group of the Midwest ISO. In December 2008, the Midwest ISO published a report that outlined three ways in which demand response could be brought into the marketplace.7 In the first approach, dynamic pricing would be offered by the load-serving entities and be assimilated into their load forecasts. Such an approach is practiced currently in Australia. In the second approach, negatively sloping demand curves would be bid into the wholesale market. This is price-responsive demand. In the third approach, DR would be bid in as negawatts. This does not rely on retail dynamic pricing and is currently the most widely-used approach.
Three academics who serve on the Market Surveillance Committee of the California ISO have published a paper that calls for a shift in emphasis toward dynamic pricing programs and away from traditional, rebate-based programs, which they refer to as the “weak” form of DR:
Any paradigm that sells “reductions” from an exogenous baseline will crowd-out the adoption of direct pricing options such as critical peak and real-time pricing. Thus, we fear that the adoption of this weak form of demand response will ultimately work against the adoption of a truly symmetric treatment of load and generation that is an essential component of an efficient wholesale electricity market. There is a significant risk of creating conditions that will crowd out true price response by focusing too much on DR programs with unverifiable baselines and reliability-based rather than price-based mechanisms for obtaining consumption reductions.
This crowding out also can occur by inflating the attractiveness to consumers of such DR programs relative to responsive pricing by overpaying for reductions that don’t actually occur. Even customers who are fully capable and willing to participate in dynamic pricing programs might prefer to instead participate as DR customers, simply because the baseline problems could work to their advantage. Thus, the current paradigm of DR, if it comes to dominate industry practice, could become the single largest barrier to truly price-responsive demand. 8
Regulatory Concerns
Today, outside of pilot programs, fewer than 50,000 residential customers receive service using dynamic pricing tariffs, and they are located in a few states, such as California, Florida and Illinois. A major reason why dynamic pricing hasn’t been offered to residential customers is the absence of advanced metering infrastructure (AMI), which is a technological prerequisite.
The picture is changing rapidly. A FERC survey published in December 2008 showed that five percent of the 145 million meters in the United States were part of an AMI system, up from 1 percent just two years earlier.9 Citing published reports by utility and metering companies, it projected that 52 million AMI meters would be rolled out during the next five years.
With the AMI train rolling down the track, can the dynamic pricing train be far behind? The answer depends on how effectively some intervenors that have an inveterate opposition to dynamic pricing can raise the specter of calamity in proceedings before state regulatory commissions.10 These intervenors have argued that dynamic pricing will harm an eclectic group comprised of low-income customers, the elderly, the very young and the disabled. In most cases, these intervenors have presented no empirical data to back up their claims. Even then, commissions are taking their concerns seriously, since they are wary of engendering a customer backlash.
An additional barrier is posed by newly emerging concerns about privacy and cyber security that are associated with the digitization of the economy and the rapid penetration of the Internet. For some people, the smart grid conjures up an image of an Orwellian Big Brother intruding into customer lives. To the extent these concerns slow down the penetration of AMI, they’ll slow down the penetration of dynamic pricing.
Among all the barriers, concerns about equity dominate the conversation in the regulatory arena. They need to be addressed if the benefits of dynamic pricing are to be realized.11 Indeed, a leading university in the East Coast plans to hold a conference this spring to discuss the equity issues. In the absence of hard empirical data, these concerns can be addressed only at the theoretical level. Appropriately, the conference is being sponsored by the department of philosophy! Once empirical information becomes available on customer acceptance and satisfaction with dynamic pricing rates, fears about a ratepayer revolt should abate.
A new crop of pilot projects studying customer satisfaction with dynamic pricing rates have produced very encouraging initial results. One of the newest pricing pilots is the Smart Energy Pricing (SEP) pilot carried out by BG&E in Maryland during the summers of 2008 and 2009. Customers who participated in the pilot overwhelmingly supported dynamic pricing.12 Two thirds of the participants (63 percent in 2009 and 62 percent in 2008) said they were “very satisfied” with the pilot program, and nine out of 10 participants stated they were either “very satisfied” or “satisfied” (92 percent in 2009 and 93 percent in 2008). Notably, when asked if they would like to continue with the smart energy pricing program, 99 percent said yes in 2009 and 98 percent said yes in 2008.
When asked if dynamic pricing rates should be made the standard offer rate, 93 percent of 2009 pilot participants who were on the peak-time rebate said yes. In 2008, 80 percent of the pilot participants (some of whom were on peak-time rebates and some on critical-peak pricing rates) had said yes.
The Plan-It Wise Energy Program (PWEP) pilot carried out by Northeast Utilities in Connecticut during the summer of 2009 also shows very positive early results. When asked to rate their experiences with the dynamic pricing tariffs on a scale of 1 to 6, with six being the most favorable, participants gave it a satisfaction rating of 5.1.
Dynamic Pricing Potential
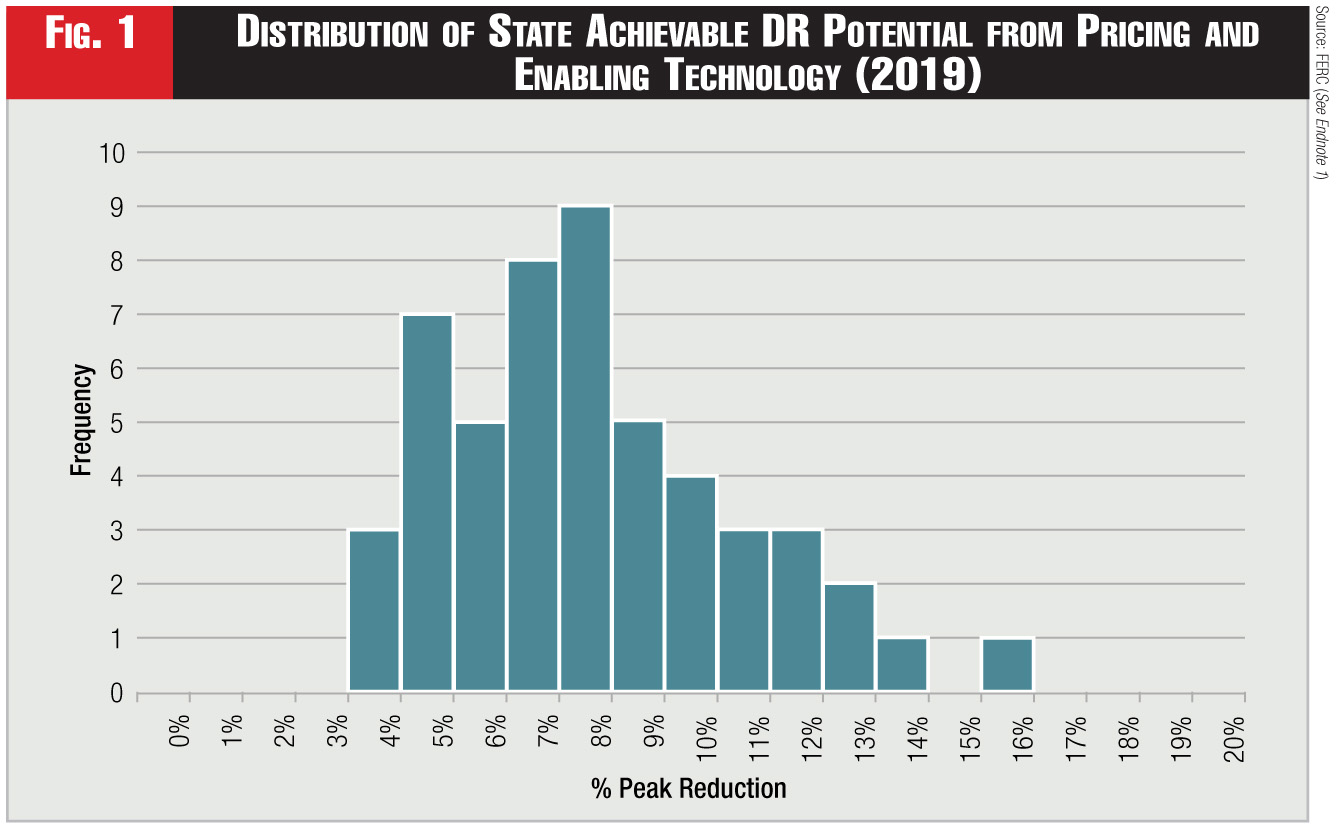
The FERC report provides an estimate of the current impact of dynamic pricing for all 50 states and the District of Columbia. In 35 of them, dynamic pricing has no impact today. Dynamic pricing rates either aren’t being offered in those states or customer participation rates are too low to produce significant impacts. In 15 states, dynamic pricing is estimated to have an impact of 1 to 2 percent. And in one it has an impact of 3 percent.
But the potential in the future is far greater. It ranges from 3 to 16 percent. Figure 1 displays impacts from dynamic pricing by itself and, where it was found to be cost effective, it also displays impacts from dynamic pricing coupled with enabling technology.
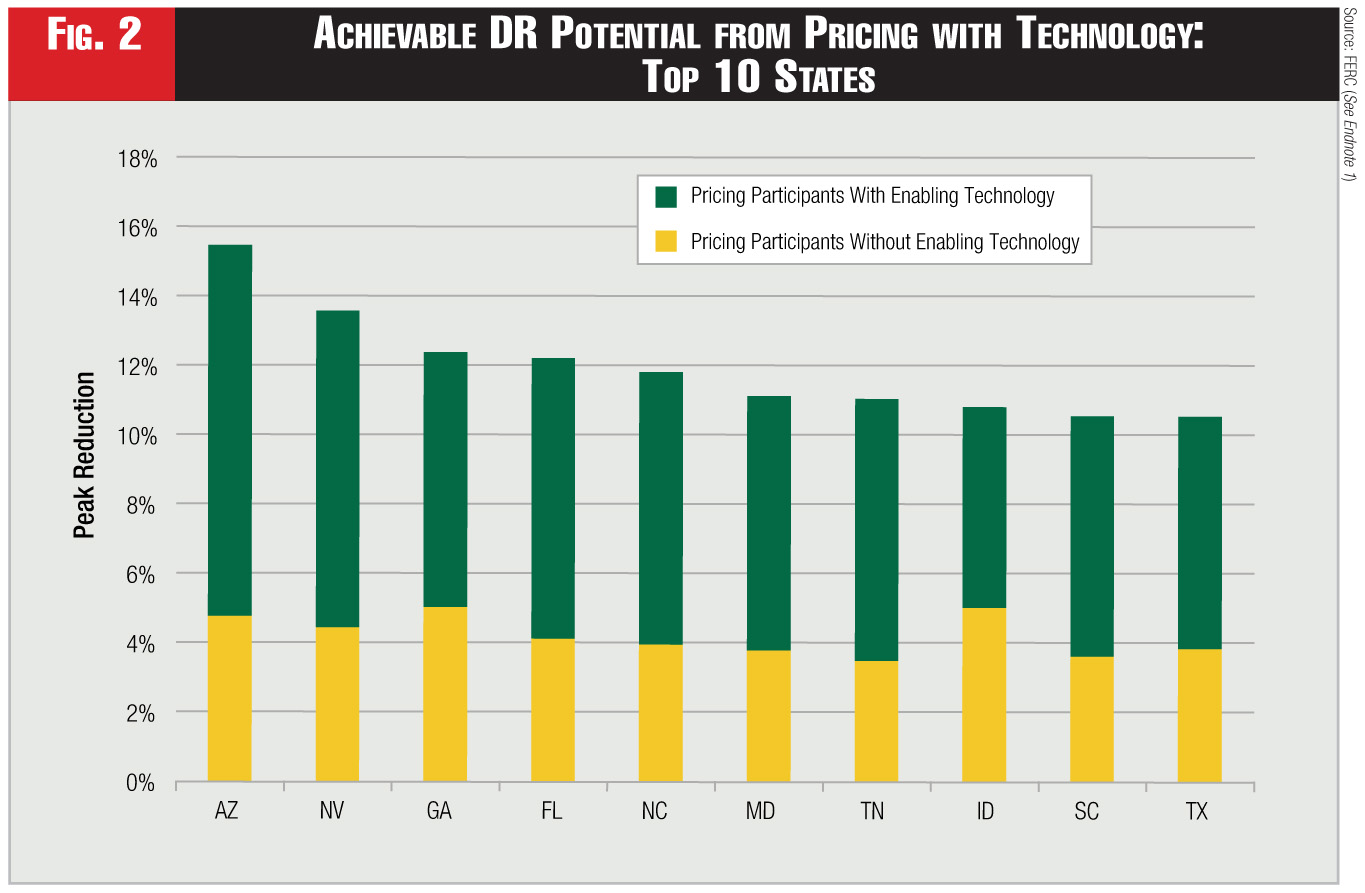
The states with the highest potential are shown in Figure 2. These states tend to have hot summers, high saturation of central air conditioning systems (i.e., energy consumption can be readily controlled by moving the thermostat either manually by the customer or automatically by the utility) and high capacity costs (i.e., enables high price signals to be sent out during critical periods).
All of this emphasis on dynamic pricing at the retail and wholesale levels raises the question: How much demand response can we expect from it? The FERC report provides an answer: The impact could range between 14 and 20 percent of peak demand, or 138,000 to 188,000 MW, depending on whether dynamic pricing was deployed on an opt-out basis or on a universal basis. If it was deployed on an opt-in basis, the impact would be much smaller.
It’s important to note that the residential class dominates the FERC results on dynamic pricing. This class hasn’t been the focus of utility dynamic pricing programs.
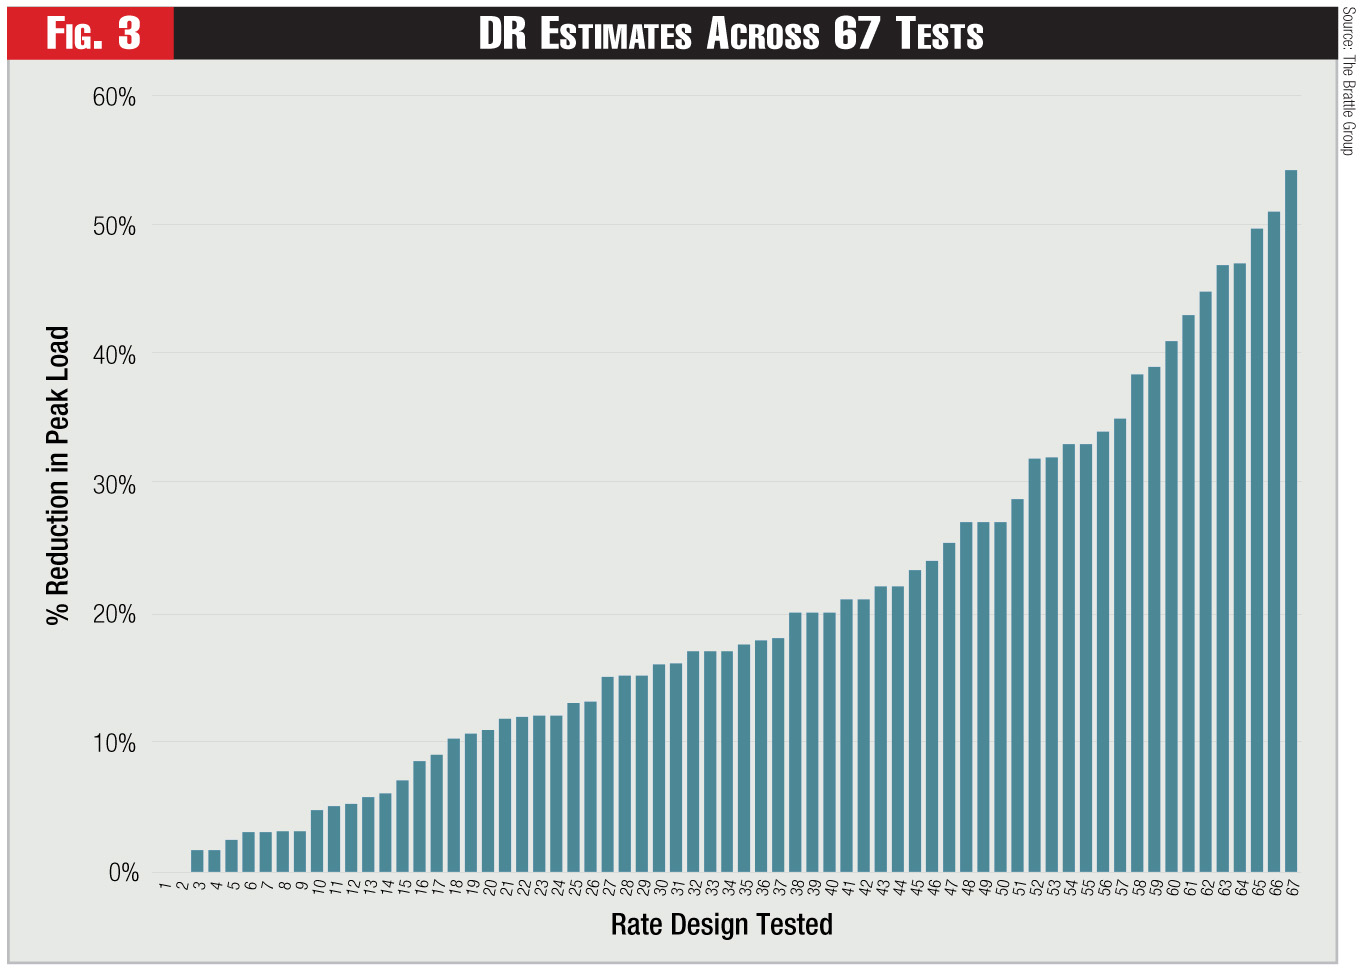
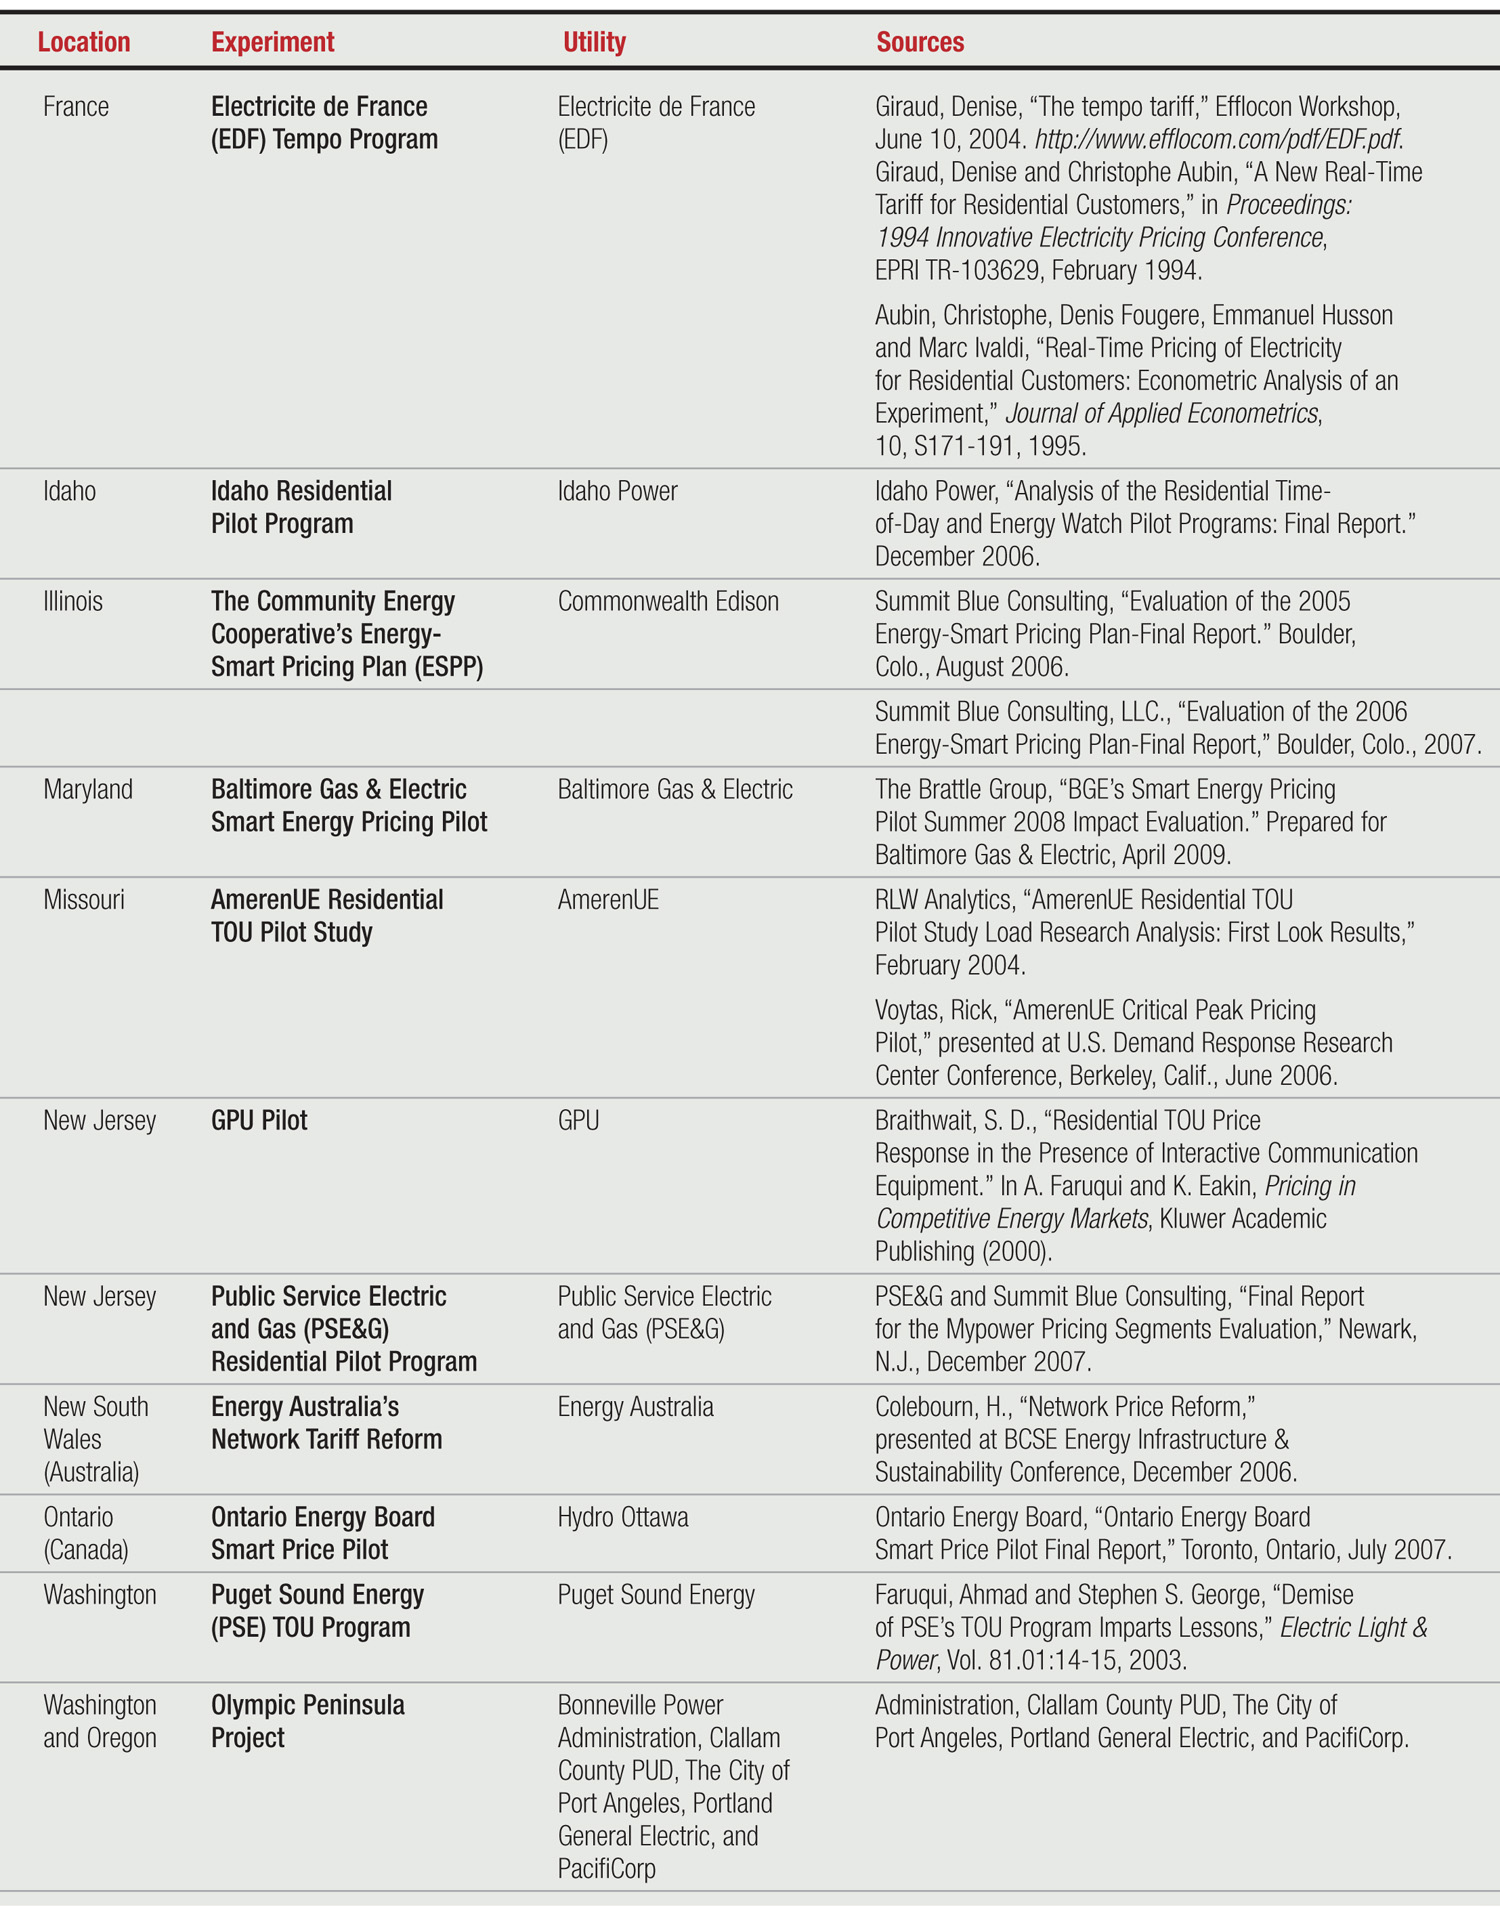
The FERC projections of dynamic pricing rest on an empirical foundation provided by several dynamic pricing pilots.13 Since that report was published, results have become available from the Connecticut and Maryland pilots, and an interim report also has been released from the PowerCents DC pilot in the District of Columbia.
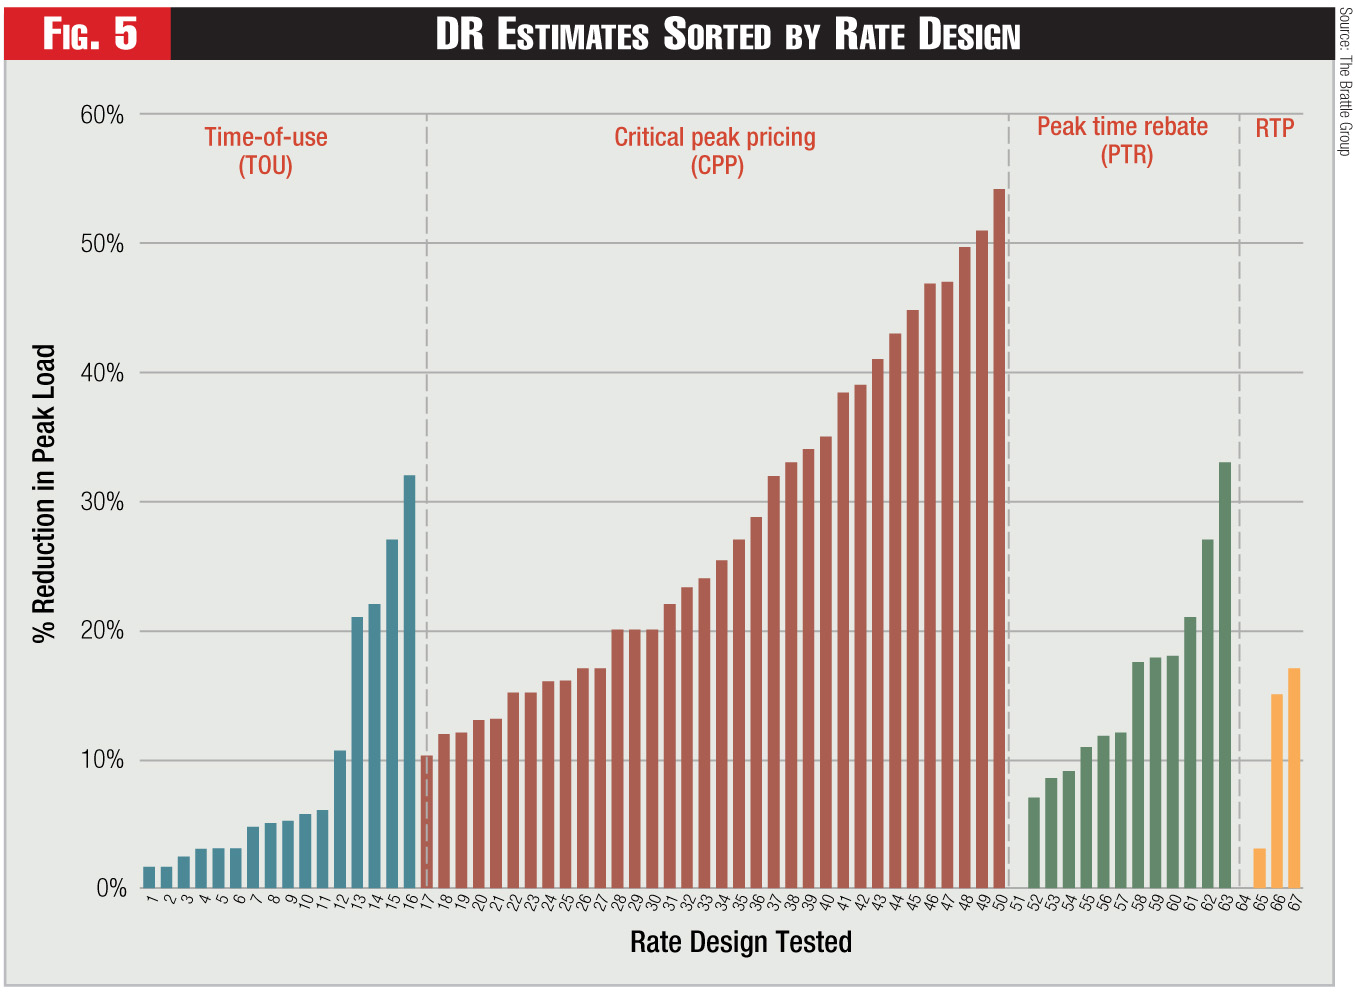
Collectively, these pilots embody 67 different tests of dynamic pricing rates (see Figure 3). The results show a huge amount of variation in affecting load, with the low end being under 5 percent and the high end being greater than 50 percent. Such order-of-magnitude variation stifles policy analysis. Thus, some analytical filters must be applied to the data to improve the resolution of the impacts.
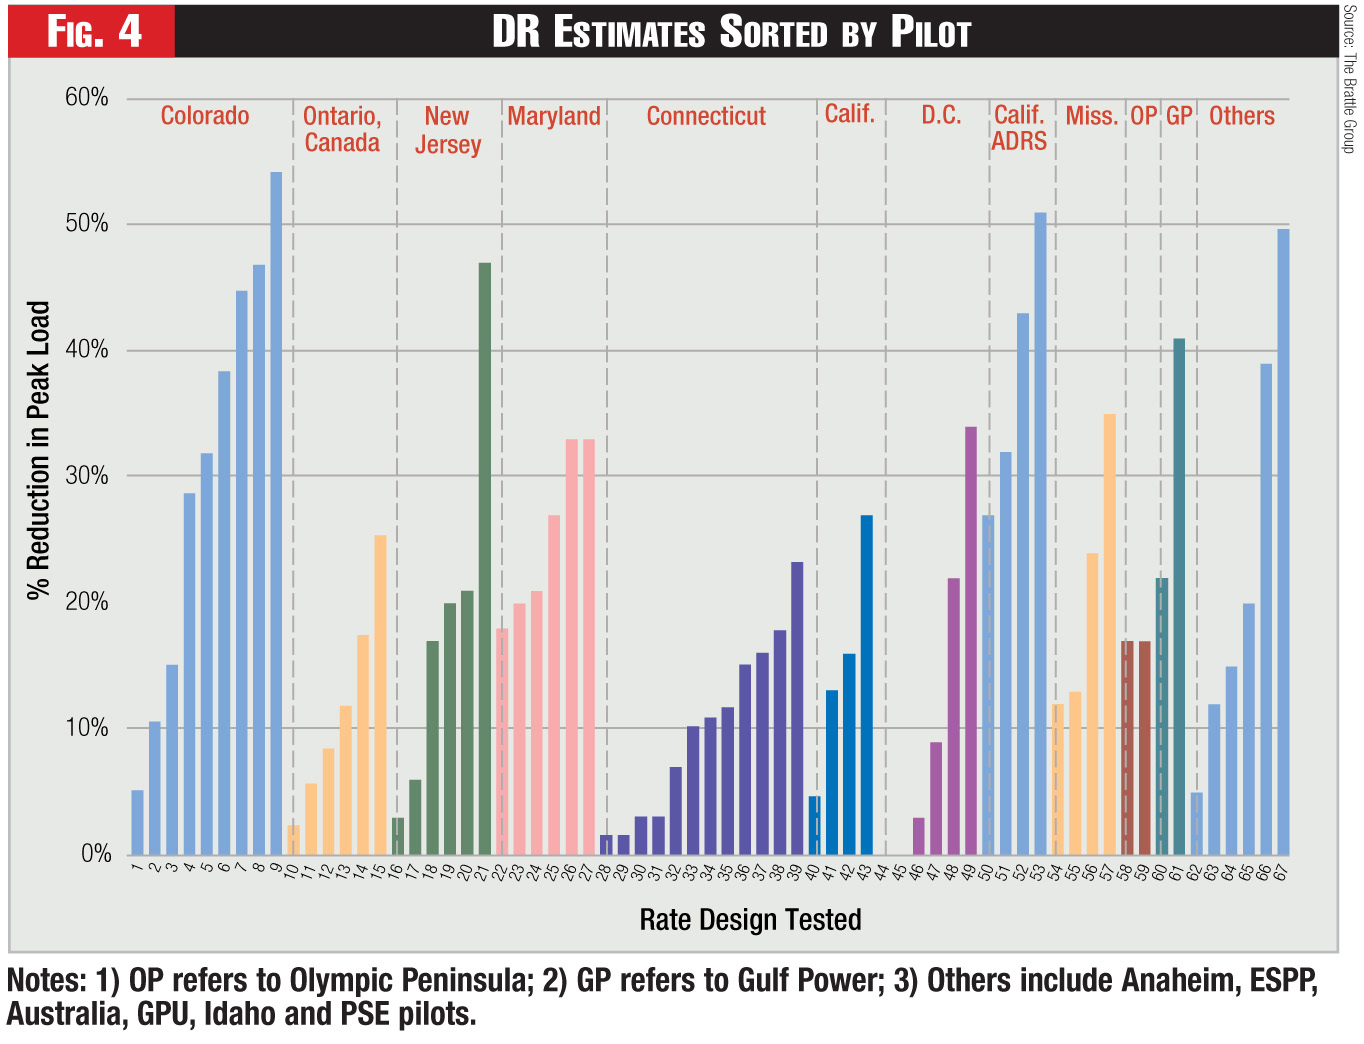
The first filter is simply to group results by pilot. This isolates the geographical variation across pilots and isolates the effects of pilot design and provides some additional resolution (see Figure 4). But a fair bit of intra-pilot variation still remains.
The second filter is to group the results by rate type. This improves the resolution considerably (see Figure 5). Critical-peak pricing (CPP) rates vastly exceed the effectiveness of simpler time-of-use (TOU) rates, in large measure because prices during the critical-peak hours of the CPP rate are much higher than those during the normal peak hours in a TOU rate. However, within the family of CPP rates, there remains a huge amount of variation.
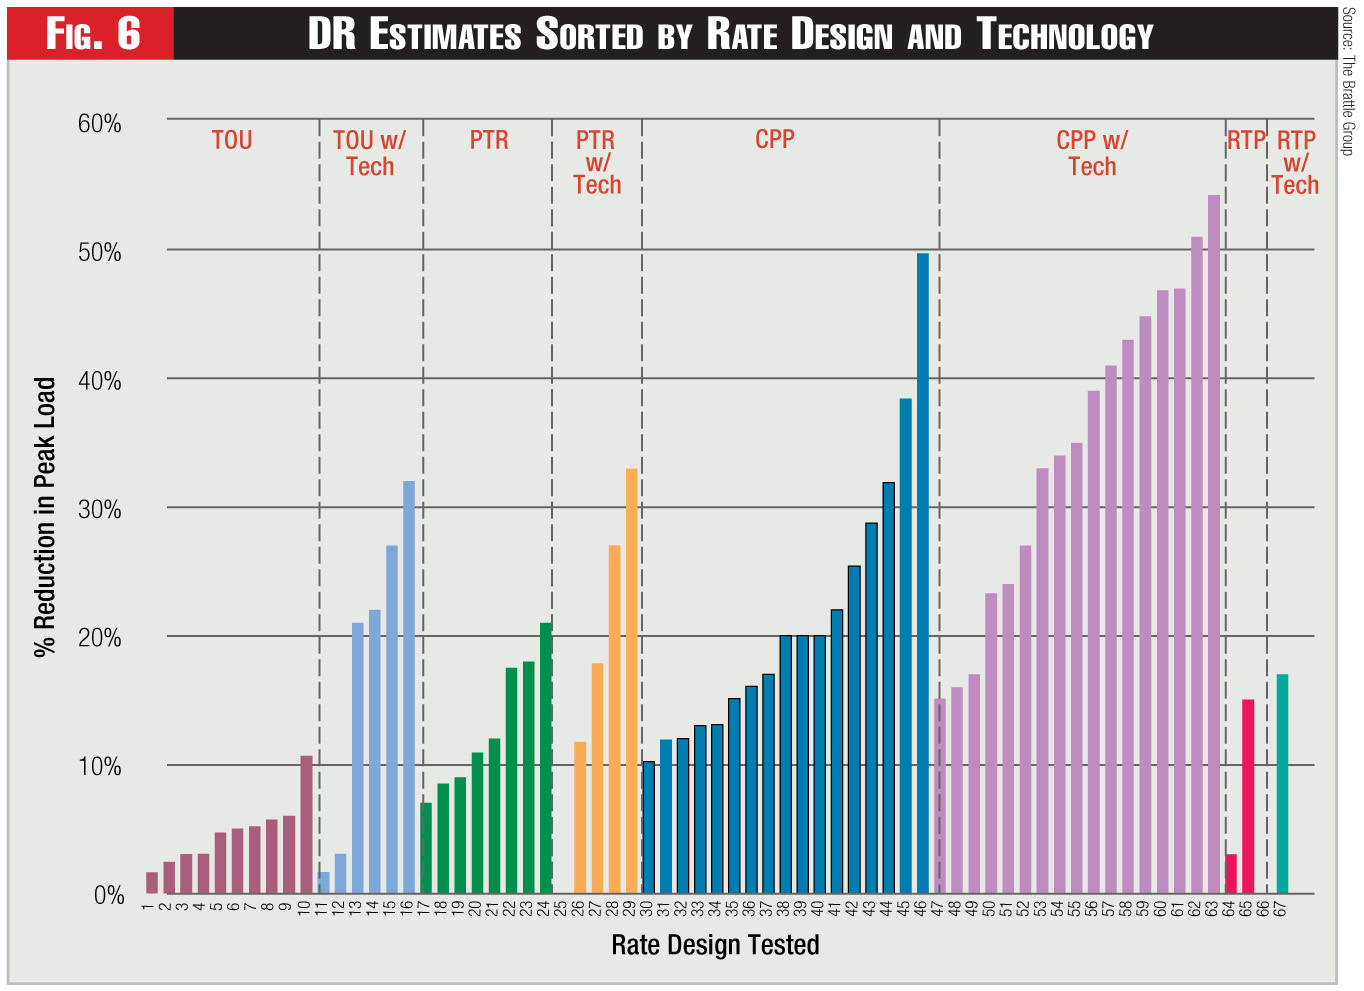
The third filter separates those tests that included enabling technology from those that didn’t. The hypothesis is that enabling technology will boost impacts, and this is borne out empirically in good measure (see Figure 6). The results are much sharper than any of the previous figures. Unfortunately, this amount of variation is still much too large for policy work.
One way to resolve the variation in the data is to use a consistent model that combines the information across all pilots. Such a model doesn’t currently exist. It might be something that DOE, as the issuer of stimulus grants, should consider pursuing in the future, especially as data becomes available from the next generation of pilots being funded by its grants. In the near term, analysts are relying on the Pricing Impact Simulation Model (PRISM) that was developed in California’s statewide pricing pilot.14
PRISM was the major analytical tool used in the FERC project. But before it could be used, a validation exercise was carried out. A key input into PRISM is the saturation of central air conditioning systems. Other inputs include the existing rate, the new rate and weather conditions. When these data were input into PRISM for a subset of the pilots, and the results compared with those estimated by the pilots, it was found that PRISM was over-estimating DR in hot and humid climates by about 20 percent. Thus, a decision was made in the FERC project to use PRISM as is done for states west of the Rockies and to use PRISM with a 20-percent downward adjustment in states east of the Rockies.
Rating the Experiments
Individual utilities and states that have carried out their pilots are likely to use their own results for estimating the costs and benefits of full-scale deployment of AMI and dynamic pricing. The caveat is that the pilots shouldn’t be impaired with intrinsic design problems that affect their internal or external validity.
For example, pilots that didn’t feature random selection of participants likely will suffer from self-selection bias. If they feature valid control groups, they may be able to establish a valid cause-and-effect relationship within the pilot, saying that a particular dynamic pricing rate lowered the peak demand of treatment group customers by X percent relative to control group customers. But this result might not be applicable to the population outside of the sample.
Pilots that have too few participants can’t yield statistically valid results. For example, the highly cited Olympic Peninsula pilot in the Pacific Northwest featured just over 100 customers. It was a great demonstration of new technology in the form of price-sensitive smart appliances: Three different rate designs were tested, but can the savings estimates attributed to these technology-enabled rate designs be used outside of the pilot? Most econometricians would demur. To be able to draw valid inferences, a study should include about 100 to 150 customers in a treatment cell comprised of a single rate and technology combination, and another 100 to 150 customers in a control group.
Some pilots have featured insufficient price variation. The classic example is Puget Sound Energy’s pilot, which ran during the 2000 to ’01 period. The peak period price was only 15-percent higher than the standard rate, and the off-peak period price was only 15-percent lower than the standard rate, yielding a ratio of 1.3:1 between peak and off-peak rates. Such minor rate differentials make it difficult for customers to achieve sufficient savings in their utility bills, de-motivating them from making behavioral changes necessary to shave peaks or transfer them to off-peak periods.
Many pilots with real-time pricing also suffer from this weakness because they don’t allocate capacity costs during the critical hours of the peaking season and spread them out uniformly over all 8,760 hours of the year.
Many pilots suffer from another weakness: They offer only a single dynamic price to customers in the treatment group. This makes it difficult to derive price elasticities with any degree of precision. This can become a serious problem if the utility or load- serving entity wants to engage in price-responsive demand bids to the wholesale market. In addition, by limiting themselves to a single price, all they are able to do is estimate the impact of that specific price by using analysis of variance or analysis of covariance. They aren’t able to estimate demand curves, which would allow them to predict future responses to alternative price levels. This capability is critical for making long-term forecasts under conditions of price uncertainty.
A few pilots don’t have any control group at all. It becomes difficult to predict the behavior of treatment group customers on treatment days since such behavior can be inferred only with reference to a comparable group of customers who weren’t on the treatment—i.e., a control group. Such pilots have limited internal validity. The best they can hope to do is to compare the behavior of treatment group customers on treatment days to their behavior on non-treatment days—i.e., the treatment group becomes its own control.
The lesson for those who have done their own pilot is to make sure it’s consistent with the scientific principles of experimental design. If it doesn’t hold up to these principles, they should consider conducting a new pilot that does.
Pathways to the Future
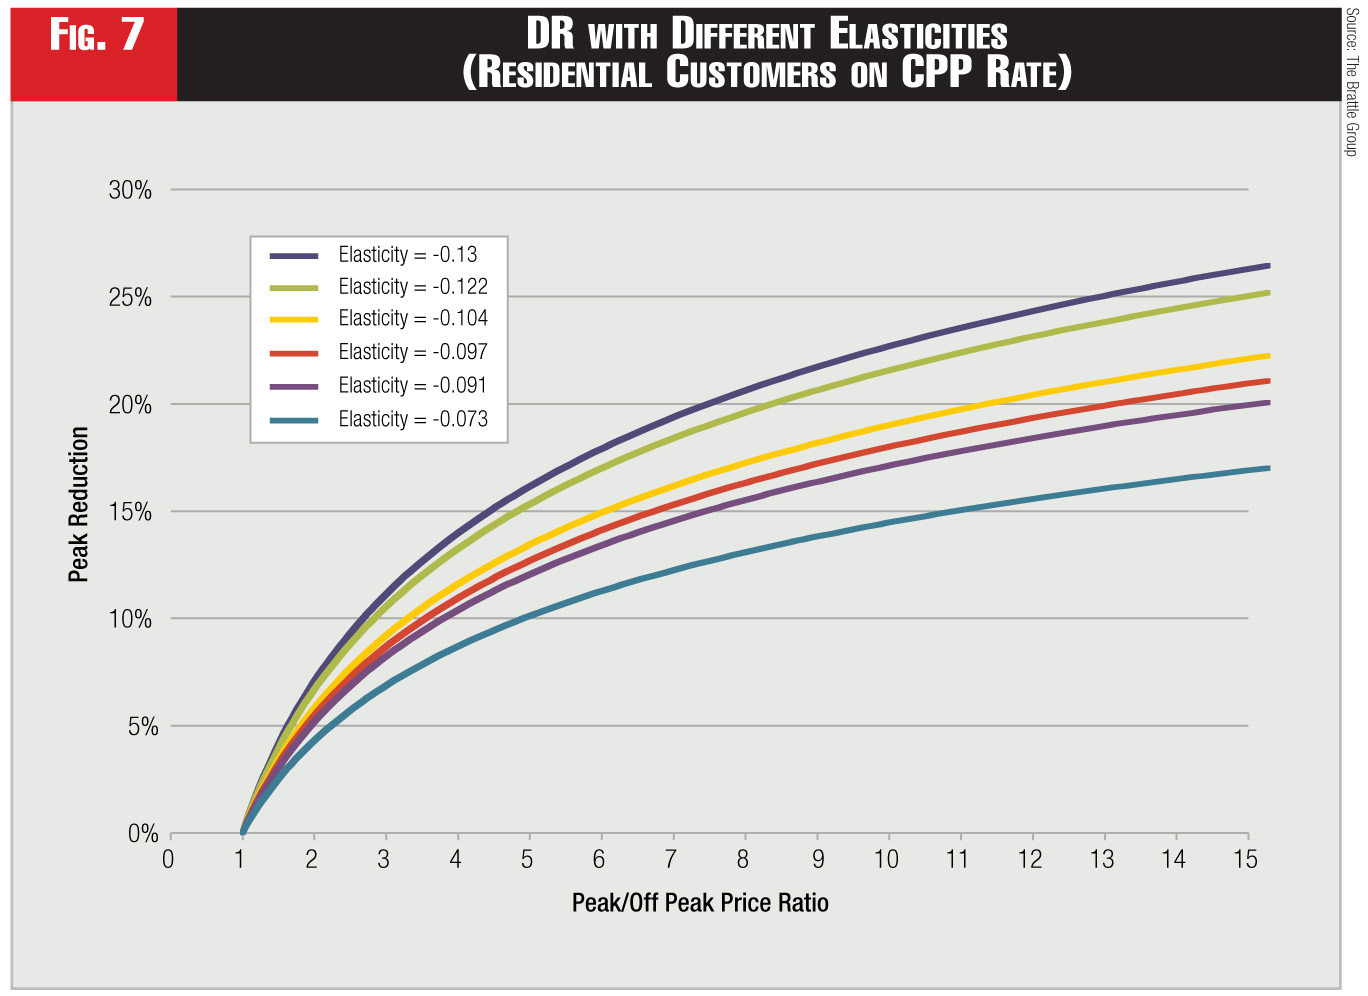
So what does the policy analyst do who has never carried out his or her own pilot? The analyst could decide to rely on the FERC results. However, there is significant variation in a key analytical parameter—the elasticity of substitution—across the pilots. This elasticity measures the extent to which customers are likely to curtail peak usage in response to higher peak prices, and provides a summary measure of the ability of customers to curtail peak loads or shift them to off-peak periods.
The variation in elasticities is illustrated in Figure 7 using information from the pilots that reported this parameter. The results being shown are for customers who are offered dynamic pricing rates but not offered enabling technologies. The lowest elasticity in the figure has a value of -0.073 and the highest one has a value of -0.13.15 The impact of this variation in elasticities on the magnitude of DR enabled by dynamic pricing is significant. For example, if a dynamic pricing rate were to be offered where the ratio of peak to off-peak rates is set at 8:1, it would yield a low-end response of 13 percent and a high-end response of 21 percent.
Faced with this variation, the analyst risks making a career-limiting mistake in his or her cost-benefit analysis. This can be exemplified by reviewing the situation in California in the summer of 2002. Seeking to prevent another energy crisis, the California Public Utilities Commission initiated proceedings on DR, advanced metering, and dynamic pricing. Early on, it became clear that the decision to deploy advanced metering was very risky without further information specific to the deployment area. A preliminary cost-benefit analysis using price elasticities from the literature on time-of-use pricing (which ranged from -0.10 to -0.30) carried out for an investor-owned utility showed that such deployment would provide gross benefits ranging from $561 million to $2.6 billion. The cost of AMI, net of operational benefits, was estimated to be $1.08 billion. This suggested that the net benefits would range from a loss of $519 million to a gain of $1,557 million. In other words, the range of net benefits, at some $2 billion, was very wide.16 A decision then was made to carry out what later became known as the statewide pricing pilot.
Second, the analyst might find himself or herself in the fortunate situation of having a neighboring organization that has done a similar pilot. The analyst simply could borrow the neighbor’s results. However, this approach also entails several risks as the geographic proximity doesn’t necessarily guarantee similar customer characteristics, weather conditions, and service territory characteristics such as rural vs. urban establishments. These factors and many others easily might be different from one utility to the other and influence customers’ price responsiveness and ultimately the net benefits of the AMI deployment.
Third, the analyst could join with analysts at other utilities and seek to develop a national model that explains the inter-pilot variation. Today, while one can theorize on what causes the intrinsic variation in elasticities across pilots, there’s no way to prove or disprove the theories without doing some careful empirical work. Further research that would pool the data across the pilots probably would explain the variation and lead to a meta-analysis model with regional variation that could be used by all those utilities that haven’t yet conducted their own pilots. The cost of developing such a meta-model, while running into six figures, still would cost substantially less than every utility doing its own pilot. Such a project successfully was carried out with data from five time-of-use pricing experiments in the early 1980s by the Electric Power Research Institute (EPRI). Five were carefully chosen from a total of 14 pricing experiments carried out by the Federal Energy Administration, the precursor to the DOE. Two projects were located in California, one in Connecticut, one in North Carolina and one in Wisconsin. The overall project found that once the model accounted for differences in customer appliances and regional weather conditions, an underlying model of customer behavior emerged that could be applied successfully across the country. Again, this is the type of path-breaking research project that could only be led by national organizations such as DOE, EPRI or FERC.
Finally, the analyst could decide to conduct his or her own pilot. He or she should be prepared to answer management and regulatory concerns about the cost-effectiveness of the pilot. The method used to assess the value of the pilot in California provides a useful point of reference. Emphasis should be placed on testing new concepts, not just repeating old concepts. A particularly comprehensive and innovative design featuring 8,000 customers was laid out by Commonwealth Edison last year.17 This design was reviewed and approved by the Illinois Commerce Commission in October 2009 and will be rolled out in 2010.18
The Com Ed pilot will test a variety of customer applications consisting of rate designs, Web portals, in-home displays and smart thermostats in 24 combinations. Notably, it will test inclining block rates, which haven’t been the subject of controlled experimentation anywhere else. And its dynamic pricing rates will overlay critical-peak pricing rates, and peak-time rebates will be layered on top of hourly pricing rates, another untested innovation. In many ways, the project has raised the bar for experimental design—and provides a preview of how accurate empirical data will clarify the future of DR in America.
Closing the Data Gap
At FERC’s technical conference in November 2009, John Haney of Florida Power & Light summed up the issues well when he said, “True DR pricing mechanisms, as distinguished from traditional time-of-use and similar programs, have to date only had limited pilot testing. Though promising, their persistence and reliability is as yet unknown. The good news is that the next few years will present the opportunity to evaluate various alternatives through company-specific research and trials on a broader scale as AMI begins to be more widely deployed. Since there are no long-term experienced operators today, the dissemination of others’ experiences and tools amongst providers could prove valuable to many.”19
The need for pricing pilots is unlikely to abate with time, since customer needs continue to evolve with changes in social mores and cultural norms. The biggest such change in recent history has been the acknowledgment of climate change by the general public.
In terms of new rate designs, we can expect to see future rate designs being tasked with multiple social objectives such as energy efficiency, demand response and renewable energy. Combination rates featuring inclining blocks, dynamic pricing and time-of-day pricing will become the norm. Ethnographic research will need to be carried out so that pricing information can be conveyed simply and directly to customers. Energy bills will have to be redesigned so customers can see a clear connection between their energy using behaviors and their utility bills.
There will be rapid innovation in the technology space as well. Smarter in-home displays and other ways of providing feedback about energy use patterns and costs will become commonplace, as will smart price-sensitive appliances. Additionally, we will see the rapid deployment of such customer-side renewable resources as roof-top mounted photovoltaic panels and distributed generation. Plug-in hybrid electric vehicles also are expected to hit the road in large numbers in the decades to come. Such technologies have a marked diurnal usage pattern, so managing them successfully will depend on widespread deployment of time-of-day rates. Thus, this traditional form of dynamic pricing likely will get a new lease of life as it’s repurposed to support the successful operation of the smart grid.
Finally, the need for pilots clearly will be the greatest in service areas with the largest gap between AMI investments and AMI operational benefits. For many utilities, this gap exceeds 50 percent. Such companies can’t afford to rely on guesses or borrowed data.
Endnotes:
1. FERC Staff, “A National Assessment of Demand Response Potential,” prepared by The Brattle Group, Freeman, Sullivan & Co., and Global Energy Partners, June 2009.
2. FERC Staff, “Assessment of Demand Response and Advanced Metering,” December 2008.
3. http://www.oe.energy.gov/information_center/1249.htm.
4. http://www.oe.energy.gov/information_center/1249.htm.
6. “Demand Response in the PJM Markets,” June 26, 2009.
7. A Faruqui, A. Hajos, R. M. Hledik and S. A. Newell, “Fostering economic response in the Midwest ISO,” Energy: The International Journal, forthcoming, 2010.
8. James Bushnell, Benjamin Hobbs and Frank A. Wolak, “When it comes to demand response, is FERC its own worst enemy,” CSEM WP 191, Center for the Study of Energy Markets, August 2009.
9. http://www.ferc.gov/legal/staff-reports/12-08-demand-response.pdf.
10. http://www.aarp.org/states/md/advocacy/articles/smart_meters_are.html.
11. Ahmad Faruqui, Ryan Hledik and John Tsoukalis, “The Power of Dynamic Pricing,” The Electricity Journal, April 2009.
12. Cheryl Hindes, “Smart Energy Pricing,” given at the Smart Pricing for a Smart Grid World, San Francisco, California, Nov. 5, 2009.
13. Ahmad Faruqui and Sanem Sergici, “Household Response to Dynamic Pricing of Electricity—A Survey of the Experimental Evidence.”
14. Charles River Associates, “Impact Evaluation of the California Statewide Pricing Pilot,” March 2005.
15. The elasticity of substitution measures the ease which customers modify their load shapes in response to price changes. For example, a value of -0.10 says that if the ratio of peak to off-peak prices were to be doubled, the corresponding ratio of peak to off-peak consumption would fall by ten percent.
16. Ahmad Faruqui, Ryan Hledik, and Sanem Sergici, “Piloting the Smart Grid,” The Electricity Journal, August/September 2009.
17. Jim Eber, “Dynamic Pricing AMI Pilot,” PJM Symposium on Demand Response, Nov. 9, 2009.
19. Prepared Opening Remarks of John Haney, Nov. 19, 2009. Docket Number AD09-10-000.
Category (Actual):