TOU Shows Tangible Results
Neil Lessem, Ahmad Faruqui and Sanem Sergici are economists with The Brattle Group, based in San Francisco, Sydney and Boston respectively. Dean Mountain is a professor of economics at McMaster University and a founder of Mountain Economic Consulting. This article is based on research for the Ontario Independent Electric System Operator (IESO). The authors are grateful to IESO staff Kausar Ashraf, Phil Bosco and Nik Schruder for their assistance during this multi-year project. The views expressed in this article are solely those of the authors and not those of The Brattle Group or its clients. Comments can be directed to neil.lessem@brattle.com. The full report is available at www.ieso.ca.




Besides Italy, the Canadian province of Ontario is the only region in the world to have rolled out smart meters to all of its residential customers and to have deployed time-of-use (TOU) rates for generation charges to all customers who stay with the regulated supply option.
TOU rates were deployed as a load shifting measure in Ontario to persuade customers to curtail electricity usage during the peak period, by shifting that usage to less expensive mid-peak and off-peak periods, or reducing overall electricity usage. While customers in Ontario were defaulted onto TOU, this rate was not mandatory since customers had the option to opt-out and choose a flat rate offered by a competitive retail supplier.
By more accurately reflecting the varying costs of supplying electricity across the day, TOU can also serve to reduce cross-subsidies between customers with different usage patterns. Worldwide, almost all residential customers face a default flat rate for electricity. However, with the mass rollout of smart meters, the idea of default TOU rates is gaining traction.
California is set to default all eleven million residential customers of California's investor-owned utilities onto TOU in 2019. While load shifting is still a goal of TOU, California is notably also using it as a tool to reduce regressive consumer cross-subsidies that have arisen with the growth of customer self-generation.
This article presents the load shifting and conservation impacts of TOU rates on residential electricity use in Ontario from their inception in 2009 through to the end of 2014. Ontario's distribution networks are run by a number of local distribution companies (LDCs), who also offer end-use customers a regulated price plan (RPP) set by the regulator.
Although customers have the option to opt-out of the RPP for a competitive retail option, the overwhelming majority, more than ninety percent, stick with it. During the study period there were more than seventy LDCs in Ontario. In order to implement TOU rates, LDCs had to first install smart meters that recorded electricity usage at different times of the day, known as interval data.
The smart meters replaced mechanical meters that only recorded incremental electricity usage and did not record the time or date of usage. Once they had smart meters installed, they could roll-out the TOU rate to their customers.
Each LDC in Ontario managed its TOU rate deployment independently. Both smart meters and the TOU rate were rolled out at different dates and over different time scales across the LDCs. If TOU was implemented concurrently with the smart meter rollout, then no record of pre-TOU usage patterns existed.
Those LDCs who participated in this study were selected in part because they had sufficiently long pre-TOU periods where customers had interval data, but were not yet on the TOU rate.
This article focuses on the impacts of TOU on conservation and load shifting for residential customers in Ontario, although the full study also includes small general service customers.
Residential customers include single family homes and individually metered apartment buildings while small general service customers are non-residential customers with demands that are less than fifty kilowatts.
Only customers with a sufficient history of hourly data in the pre-TOU period were included in the study. The final year three sample was comprised of 102,769 residential customers, including 4,038 retail customers, out of a total customer population of 2,460,025 residential customers for the participating LDCs.
Methodology
The deployment of TOU rates in Ontario was not part of an experiment. This posed an analytical challenge for constructing a control group for impact evaluation purposes. A control group allows us to account for changes in electricity usage that would have occurred in the absence of TOU.
Without a control group, it is difficult to disentangle experimental impacts from other societal changes. To account for this as best as possible, we created three levels of control groups:
We took advantage of differences in the timing of the TOU deployment across customers and LDCs, including customers who were at the tail end of the deployment as a proxy control group for those customers defaulted onto TOU earlier. While all LDCs in the study were offering TOU rates by 2012, they started offering these rates at different points in time from 2009 onwards. Since customers had no choice of when they received TOU, from a customer's point of view the rollout was more or less random.
We used each customer as their own control, comparing their usage after TOU with their usage before TOU. This accounts for any compositional differences that arise as different LDCs enter the study.
Retail customers who were not on TOU rates acted as an additional control group. Many of these customers had opted out of the RPP ahead of TOU and we found no strong evidence of self-selection into flat rates.
We employed a two-pronged approach to measure the load shifting and conservation impacts of TOU. First, we estimated an advanced model of consumer behavior called the "Addilog Demand System" to discern load shifting effects that were caused by the TOU rates and to estimate inter-period elasticities of substitution. Second, we estimated a monthly consumption model to understand the overall conservation behavior of the customers, and estimated an overall price elasticity of demand.
By using the parameter estimates from these two models and solving them together, we calculated the impact that TOU rates have had on energy consumption by period and for the month as a whole.
Results
The analysis was conducted at the regional level, with the province split into four geographically distinct regions and aggregated to the provincial level. Impacts were measured by calendar year and split into four separate calendar periods: pre-2012, 2012, 2013, and 2014.
The pre-2012 period reflects all of the years that LDCs within a region were on TOU rates prior to 2012. Some LDCs started TOU as early as 2009, while others only began in 2012, resulting in compositional changes potentially affecting the comparison between pre-2012 and later years. By 2012, all LDCs in the study were on TOU rates.
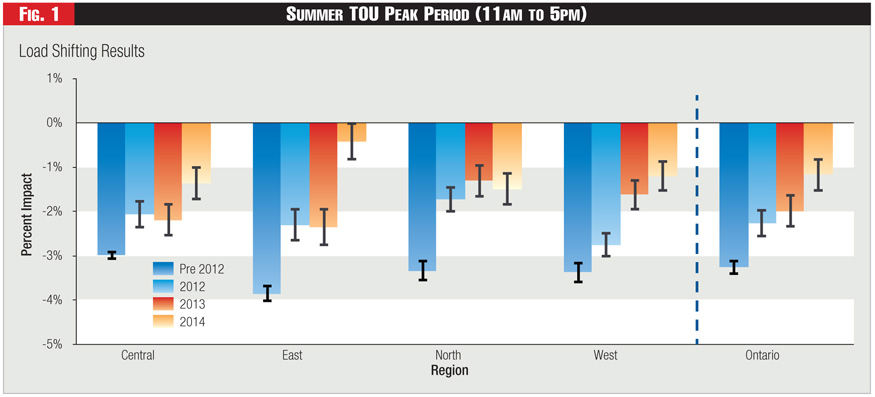
Figure 1 shows the impacts during the summer peak period, 11 a.m. to 5 p.m., across the regions and province as a whole for residential customers. The summer peak reflects the TOU peak prices seen by customers.
The impacts are the percentage change in electricity usage during this period relative to what would have been consumed in the absence of TOU. A negative impact represents curtailment of energy usage during the summer peak period. The colored bars show the impacts in various years, while the black brackets show the 95 % confidence interval.
For the province as a whole, TOU reduced usage during the summer peak by 3.26 percent in the pre-2012 period, 2.27 percent in 2012, 2.00 percent in 2013, and 1.18 percent in 2014, relative to what usage would have been in the absence of TOU.
The ninety-five percent confidence intervals on these impacts are narrow relative to the magnitude of the impacts and lie far away from zero. That leads us to be highly confident in our findings.
While we chose to focus on summer results, we also estimated load shifting impacts for the winter. These are generally smaller than in the summer rate period in the earlier years, and have decreased over successive years of the study. Lastly, there is no evidence of energy conservation.
See Figure 1.
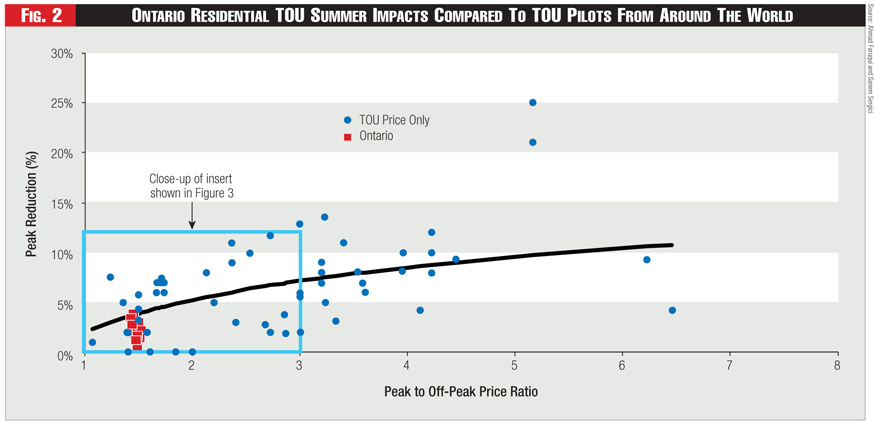
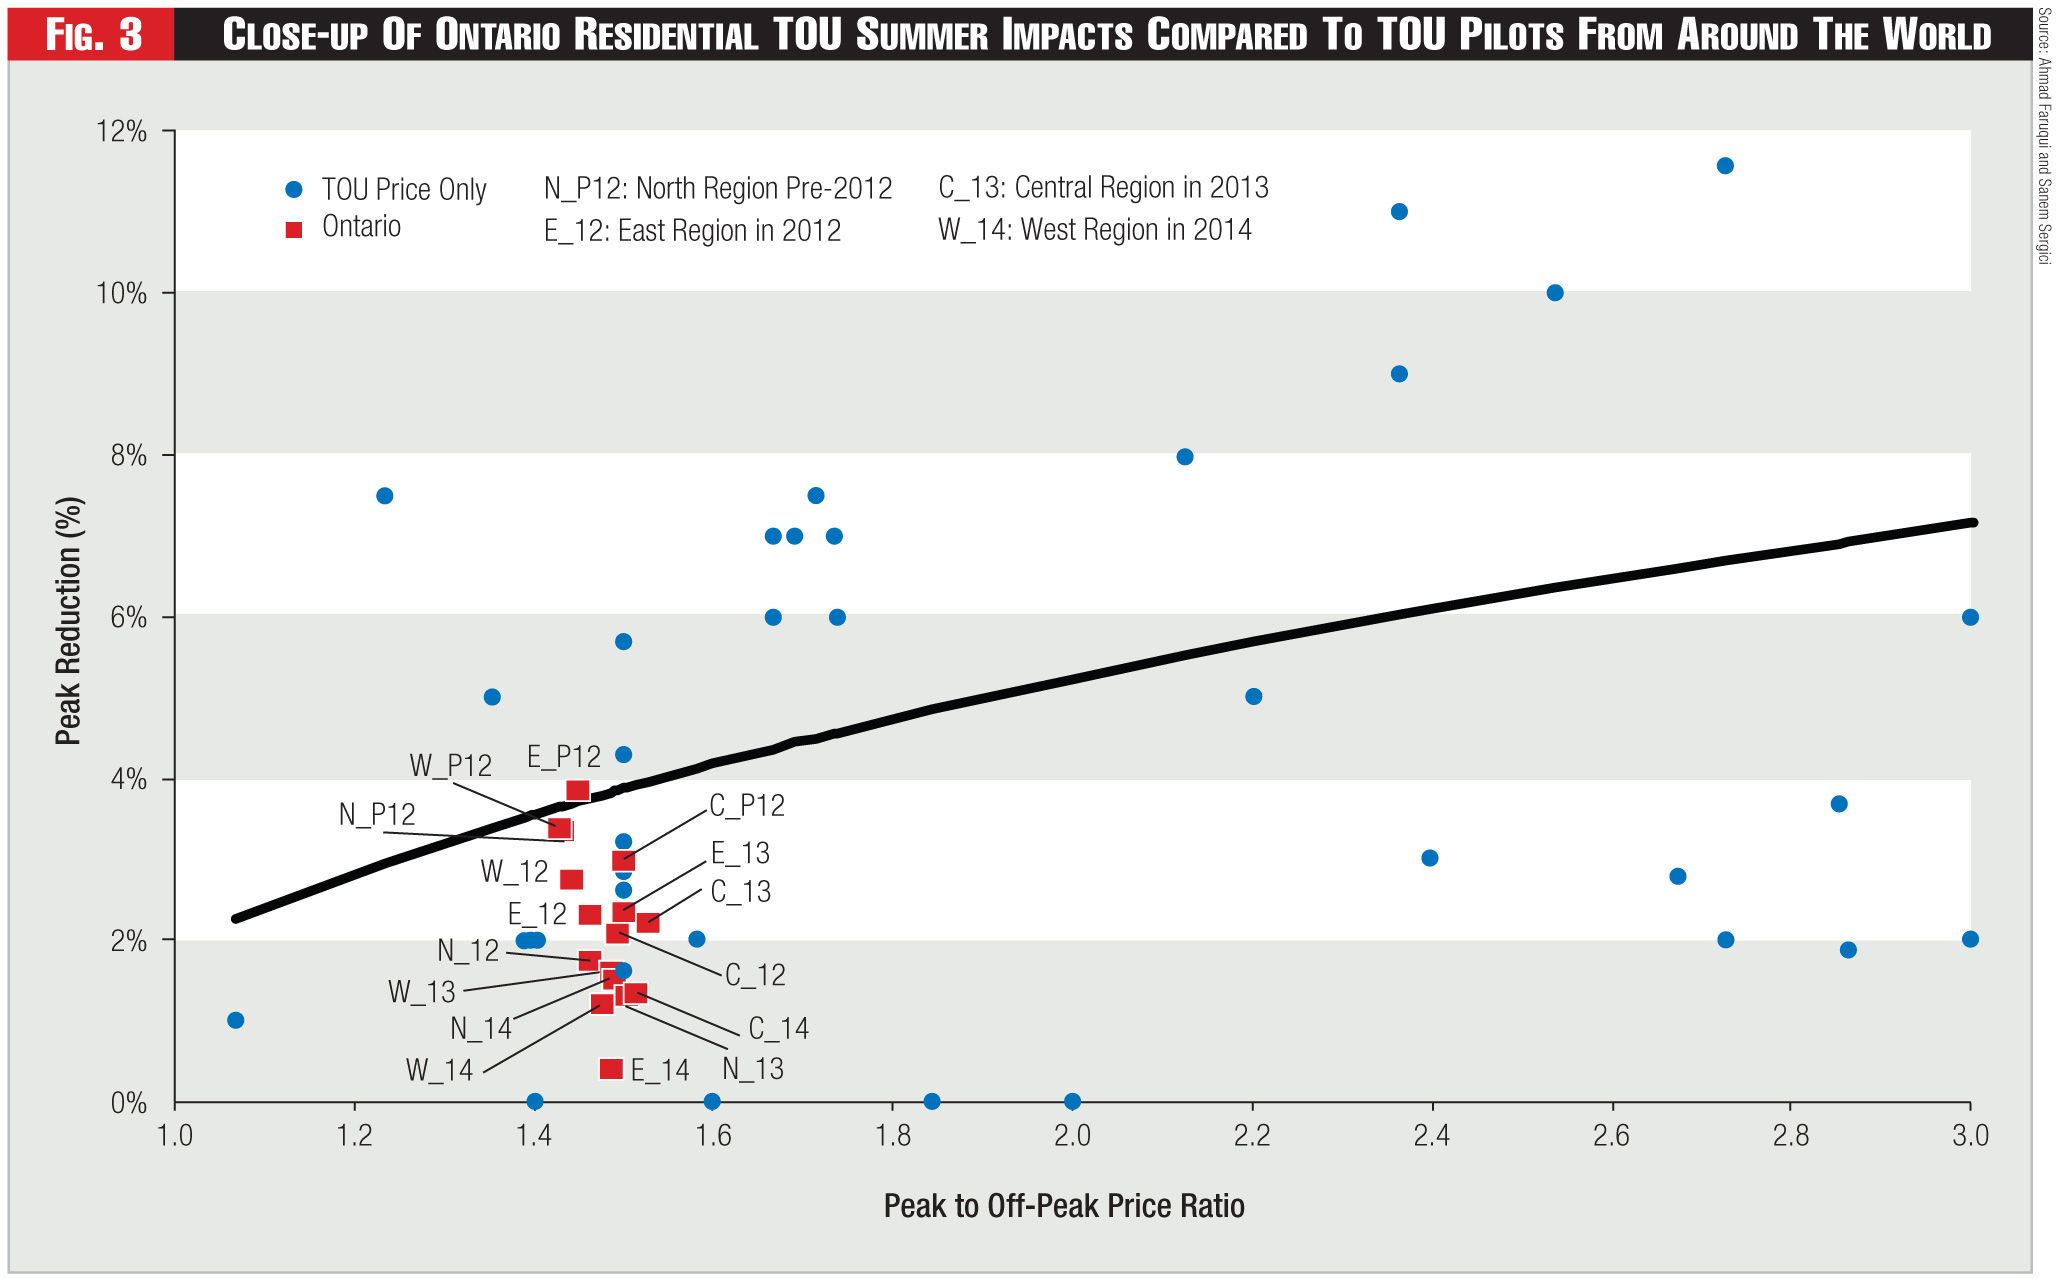
Figure 2 and Figure 3 compare the Ontario residential summer TOU peak period results to results collected from seventy-seven pilots around the world using Brattle's Arcturus database.
The IESO impacts are the only impacts reported in both figures obtained from a full scale roll-out rather than a pilot. On the y-axis is the percentage peak reduction, while the x-axis shows the peak-to-off-peak price ratio.
The blue curve is Brattle's Arc of price responsiveness, which is an econometric estimation of the curve that best fits the data. The Arc can be used to make predictions of peak reductions for various peak-to-off peak price ratios.
During the analysis period, the peak-to-off peak price ratio for all of the LDCs was approximately 1.5. This would correspond to a three percent reduction in peak usage, which is slightly lower than the provincial estimate for pre-2012, but higher than the provincial estimates in 2012, 2013, and 2014. The lower bounds or larger impacts of the ninety-five percent confidence interval for the summer TOU peak period impacts for these years were 2.55, 2.34, and 1.53 percent, respectively.
See Figure 2 and Figure 3.
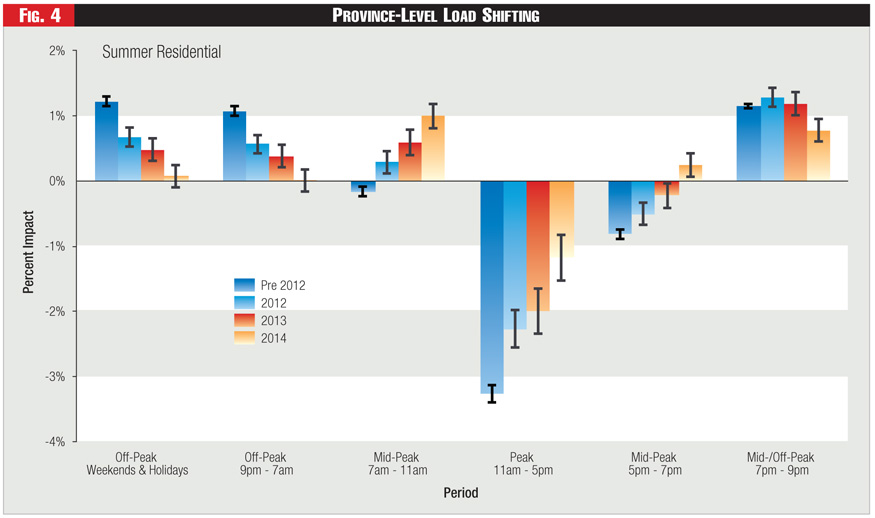
Figure 4 shows residential load shifting across all periods in the summer for the whole province.
Period 1 is weekends and holidays which are off-peak. Period 2 is from 9 p.m. to 7 a.m. and is also off-peak.
Period 3 is from 7 a.m. to 11 a.m. and is mid-peak. Period 4 is the peak period from 11 a.m. to 5 p.m. Period 5 is the second mid-peak from 5 p.m. to 7 p.m.
Period 6 from 7 p.m. to 9 p.m. is currently off-peak, but was mid-peak before May of 2011. Load is shifted from the peak and evening mid-peak period to the off-peak periods.
In 2014, there is evidence of increasing load shifting into the mid-peak periods, that is, additional shifting into the morning mid-peak period relative to prior years, and shifting into the evening mid-peak period, for which negative impacts were previously observed.
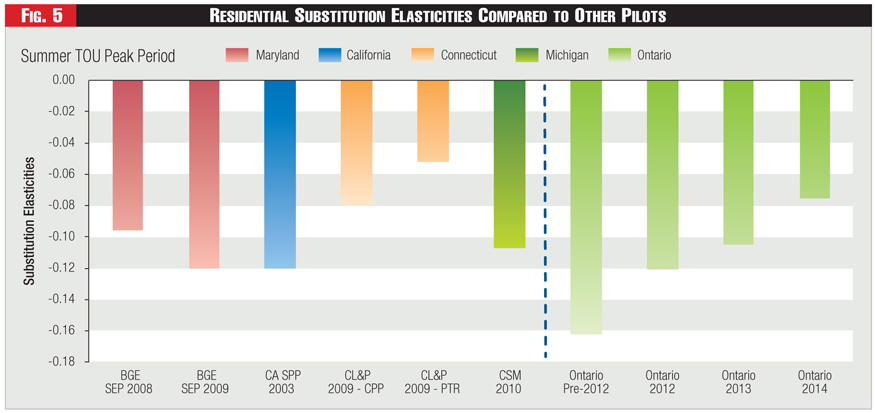
Finally, we estimated substitution and overall conservation elasticities. A substitution elasticity indicates the percent change in the ratio of peak-to-off-peak consumption due to 1 percent change in the peak-to-off-peak price ratio. For instance, a substitution elasticity of -0.10 implies that, when the peak-to-off-peak price ratio increases by 1 percent, the usage ratio decreases by 0.10 percent.
Overall conservation elasticities indicate the percent change in the average monthly consumption due to a 1 percent change in the average monthly price. For instance, an overall conservation elasticity of -0.05 implies that when the average monthly price increases by 1 percent, the average monthly usage decreases by 0.05 percent.
See Figure 4.
Figure 5 shows substitution elasticities from several other studies alongside the provincial residential summer peak elasticities. The provincial elasticities, which lie between -0.1 and -0.15, are shown on the right. Altogether, they are very similar in magnitude to elasticities observed in other studies.
See Figure 5.
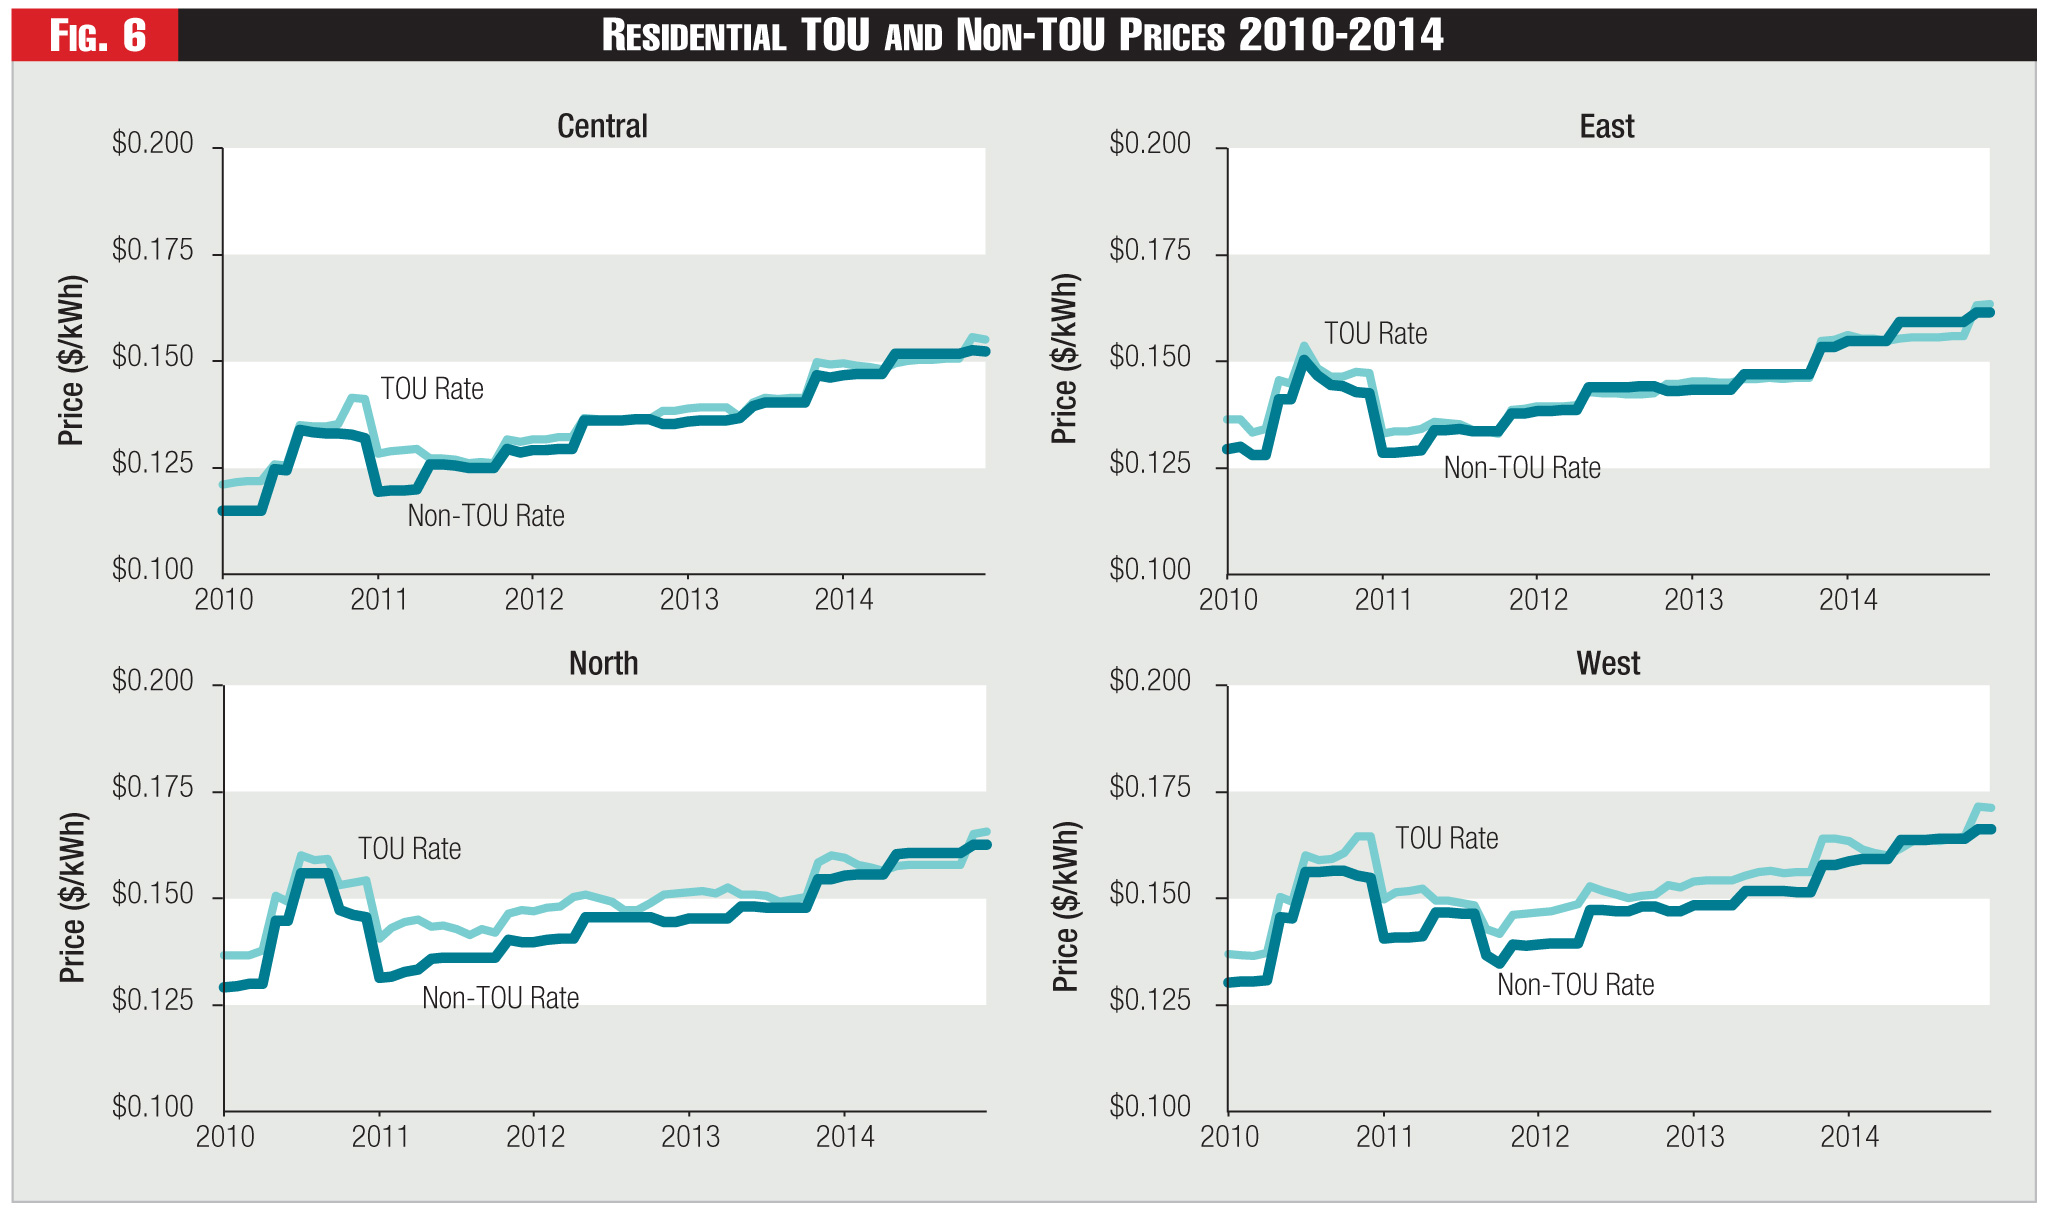
We did not find any statistically significant evidence of conservation across all regions, and thus do not report a conservation elasticity for the residential class. Figure 6 shows the average monthly TOU and non-TOU all-in prices that consumers faced from 2010 to 2014 split by region.
Both TOU and non-TOU prices are from the province's regulated price plan (RPP). Within each region the TOU and non-TOU prices track each other closely, and prices have been on a slight upward trend since 2011.
See Figure 6.
Conclusions
After carefully analyzing load and price data over a three-year period from a representative sample of customers in Ontario, we learned that default deployment of TOU rates to four million customers in Ontario has yielded tangible reductions in peak demand.
These reductions have been realized even with a TOU rate that had modest differentials between peak and off-peak periods. If the peak to off-peak price differentials were higher, there is every reason to expect that the reductions in peak demand would have been higher.
Category (Actual):
