Evidence from Florida
Ahmad Faruqui, Neil Lessem and Sanem Sergici are economists with The Brattle Group, based in San Francisco, Sydney, and Boston respectively.



There is some debate about the efficacy of dynamic pricing in hot and humid climates. On the one hand, the magnitude of load that could be potentially shifted or shed within a household is higher. On the other hand, customers may have less ability to shed this load.
We examine the impacts of dynamic pricing on conservation and load shifting in the hot and humid climate of Florida. We then compare the results to those from dynamic pricing experiments across the world.
Our evaluation is based on the Energy Smart Florida (ESF) pilot study, which was run by Florida Power and Light (FPL), the third-largest electric utility in the United States. FPL serves more than 4.8 million customer accounts, comprising more than 10 million people across nearly half of the state of Florida.
The pilot was part of a suite of experiments funded by the U.S. Department of Energy through the American Recovery and Reinvestment Act. The pilot investigated the efficacy of providing enhanced feedback to customers about their electricity usage through In Home Displays (IHDs), advanced home energy controllers (HECs), and Critical Peak Pricing (CPP) when coupled with an HEC.
The Energy Smart Florida pilot took place from August 2011 through August 2012. It was implemented as a Randomized Controlled Trial (RCT) with three different treatment groups and a control group. Hourly load data was collected on all groups during the pre-treatment and treatment periods. The pilot was both a behavioral and technological pilot.
ESF provided near real-time information through FPL’s smart meters. Each of FPL’s smart meters is equipped with two radios: a network interface radio used for utility operations such as obtaining meter readings; and a home area network (HAN) radio designed for bi-directional communication with in-home devices.
When activated, the HAN radio can communicate near real-time information to a compatible in-home device with which the radio has been paired. The elements of near real-time information can include whole-house power use, energy price, time synchronization and brief text messages.
FPL’s pilot deployed a range of HAN-enabled technologies in three treatments.
In the first treatment, T1, customers remained on the standard rate and were provided with IHDs, which gave customers near real-time feedback about their energy usage. Without the IHDs, customers could only get their aggregate usage for the past month.
In the second treatment, T2, customers remained on the standard rate and were provided with HECs. HECs had graphic interfaces similar to the IHDs but also provided the customer with appliance-level control of the thermostat, electric water heater and/or pool pump.
In the third treatment, T3, customers were provided HECs and also placed on the CPP rate structure.
Unlike the T1 and T2 cells, the thermostats, electric water heaters and pool pumps of the T3 customers were programmed to conserve energy during peak windows on dynamically chosen event days, or critical peak days. Customers could override these programmed settings.
In the CPP rate, T3 customers were charged higher prices during the event hours but received a rate discount for all other hours.
The ESF was designed to test the theory that enhanced feedback about energy usage through the IHDs and HECs would assist customers in conserving electricity, while the higher prices during critical peak pricing events will encourage customers to either shift or cut load during the event window.
Our Approach and Results
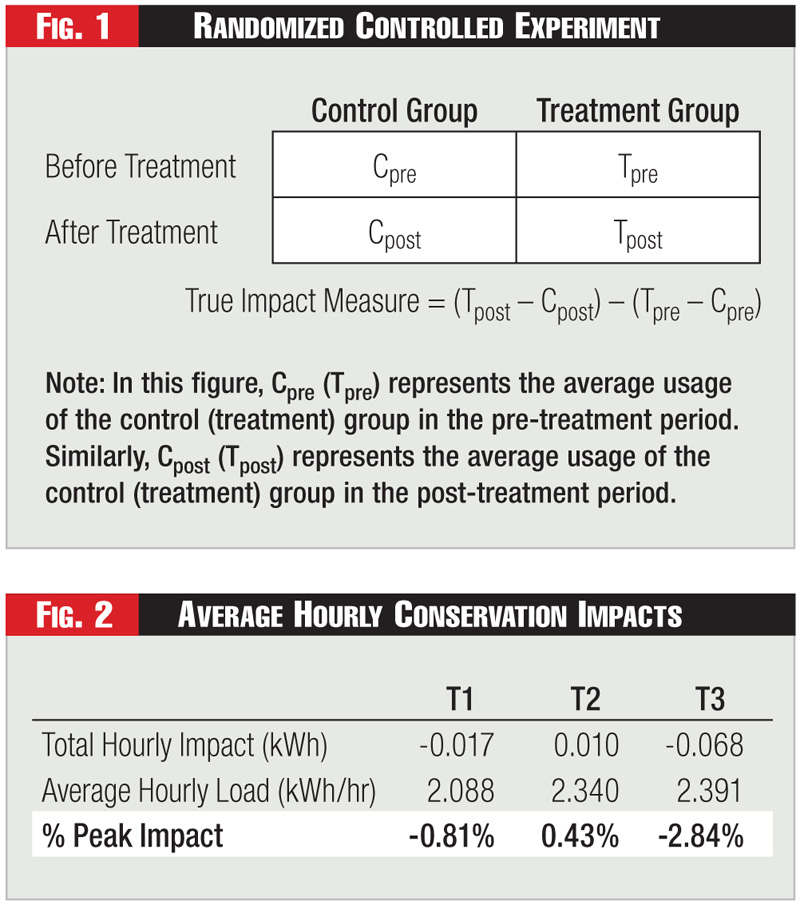
Figure One describes the design of the ESF pilot.
This experiment was implemented as a Randomized Controlled Trial (RCT), which represents the gold standard of experimental design. By randomly selecting customers in the treatment and control groups, we expect that customers in the treatment and control groups will have similar usage patterns in the pre-treatment period.
However, with smaller samples, some differences between the groups may occur. Our impact measure is the difference in electricity usage between the treatment and control group after our experimental intervention (Tpost – Cpost) net of the pre-existing differences between the groups (Tpre – Cpre).
We estimate this “difference-in-differences” impact measure using regression analysis. This allows us to increase the precision of our estimates by utilizing individual customer data, as opposed to just comparing group means, and by accounting for factors like fluctuations in weather and individual-specific usage that does not change over time. We use regression analysis to answer two primary questions:
Is there any energy conservation due to the program treatments?
Is there any load shifting due to the program treatments?
Theoretically, we hypothesize that there are several different channels through which our experimental interventions may drive energy conservation, and that at least one of these factors will have an impact on each experimental group.
Group T1 has IHDs that give the customers feedback about their energy usage. Having better information about their usage patterns may lower the costs of energy conservation behavior, allowing customers to conserve more.
For example, if the IHD shows a customer that she uses a lot of energy on a Saturday when nobody is home, she may reprogram her thermostat to turn down or off on Saturdays. In addition to the learning effects of feedback, just having a visual representation of how much energy they are using may motivate customers to conserve.
Group T2 has HECs, which give customers greater control over several of their appliances. That may make it easier to conserve energy. Additionally, the HECs also provide the same visual information as IHDs.
Finally, Group T3 has the same technology as T2 and has the same motivations to conserve, arising from the provision of information and from having control over appliances. However, there is an additional motivation arising from the need to avoid high prices in the critical peak period. Some of the energy this group conserves in the peak period may not reappear during the off-peak periods, resulting in overall conservation of energy.
We expected to see load shifting for Treatment Group T3 since it is the only group exposed to critical peak prices. We hypothesize several possible reasons why they may reduce load during critical peak periods.
First, customers may change their energy usage behaviors in response to the increased price during critical peak periods. Second, they may reduce load due to the HEC automated control, even without any behavioral change relating to the use of other appliances.
The HEC automated control is programmed to raise the thermostat temperature in summer and lower it in winter, turn off the pool pump and turn off the electric water heater. However, customers have the ability to override some, if not all, of these automatic features.
Finally, customers may decrease load during CPP events due to increased energy awareness induced by the events themselves. However, it is important to note that the critical peak prices will yield a behavior change only if the customers notice that an event is in progress.
Conservation
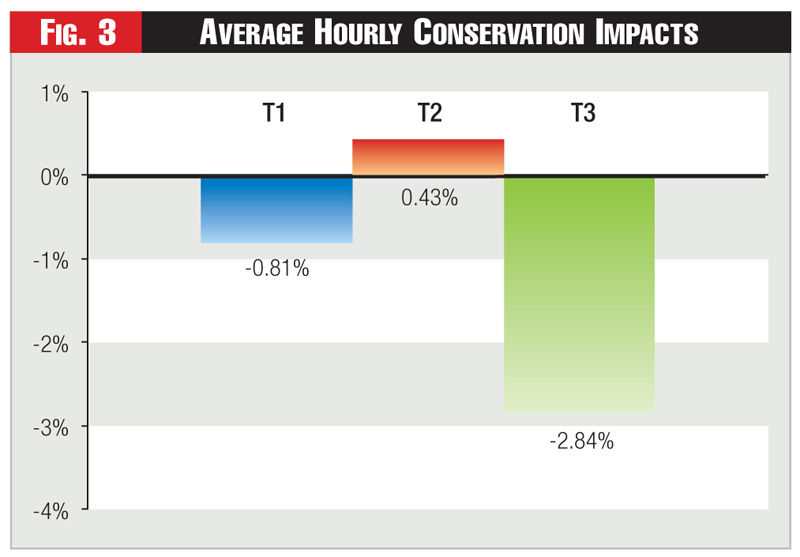
We estimate conservation impacts at the daily level. Figure Two shows the estimated total hourly impact in kilowatt-hours. We divide by the group-specific average hourly load in the treatment period to obtain the percentage impacts.
See Figure Two.
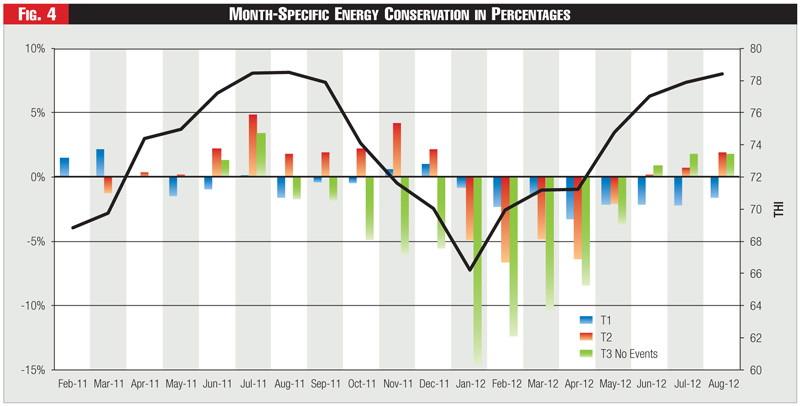
The conservation impacts in percentages are shown graphically in Figure Three. The point estimates for T1 and T3 are negative, while that for T2 is positive. However, none of these estimates are statistically distinguishable from zero.
In addition to the above analysis, we also combined Treatment Groups T2 and T3 to test whether there was an overall conservation impact from the HECs. We combined Treatment Groups T1, T2 and T3 to test whether there was an overall conservation effect from feedback about energy usage.
By combining the groups, we increase our sample size and the precision with which we can identify treatment effects. However, in both cases, we still did not find a significant conservation impact.
See Figure Three.
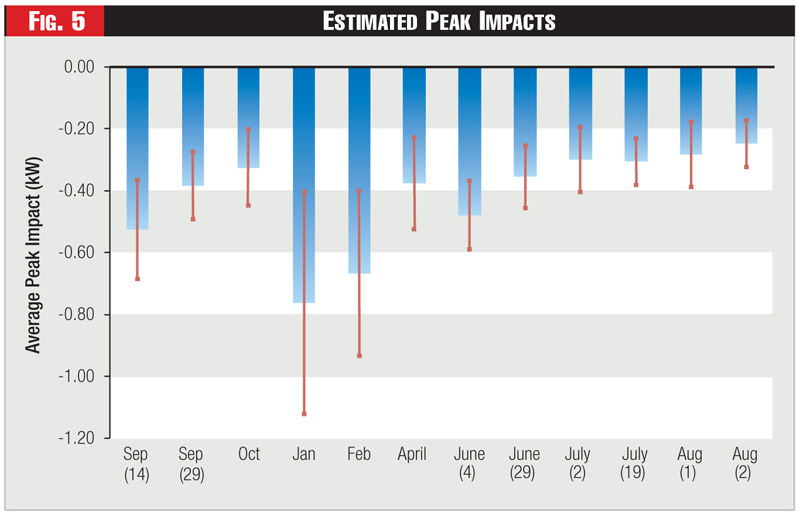
Although we found no annual average energy conservation effects, we tested whether there were month-specific conservation effects. These results are shown in Figure Four for all three treatment groups.
The left side y-axis shows energy conservation impact in percentage terms, while the right side y-axis shows the Temperature Humidity Index. Monthly energy conservation impacts are represented by bars, while the temperature humidity index is shown as a black line. Estimated impacts that are statistically significant from zero are shown as solid color blocks, while shaded blocks represent non-significant results.
See Figure Four.
For T3, we find that there are statistically significant energy conservation effects from January through April, while the months bordering this period are insignificant, but of similar magnitude. We find similarly negative but smaller effects for T2 in this period, although only the April impact is statistically distinguishable from zero.
These energy conservation impacts seem to occur in the winter and spring period, when the temperature humidity index is at its lowest. To test whether there is a relationship between THI and energy conservation we re-estimate equation 1, but allow for energy conservation impacts to vary by THI. We find that at lower THI values there are significant energy conservation impacts for T2 and T3, but they decrease to zero as the THI increases. These impacts are larger for T3 than T2.
To recap our energy conservation findings, we find no statistically identifiable overall conservation impact for any of the treatment groups on an annual basis, although it seems that the HECs did induce some conservation during the winter and spring months when the weather was milder.
Load Shifting
FPL conducted twelve CPP events, with the majority lasting three to four hours. Two lasted eight hours, the maximum duration allowed under the pilot tariff. The final two events were on consecutive days. We estimate load-shifting impacts at the hourly level.
We use regression analysis to estimate impacts at the hourly level. To obtain the average load impact over all hours in an event window, we added up all the hourly impacts during the event window and divided that number by the number of hours in the event window.
This is shown graphically in Figure Five. Even though not all of the hourly impacts during the peak event window are significant, the average impact over all hours for each event day is significantly different from zero.
The blue bars show our estimates of the average load impact, while the red bars show the interval between which we are 95 percent confident that the true impact lies.
See Figure Five.
The average load reduction across all events is 0.42 kilowatts or 14.5 percent, with the average winter reduction (January and February) of 0.71 kilowatts being almost double that of the average non-winter reduction of 0.36 kilowatts. In percentage terms, the impact is in line with pilot studies around the world.
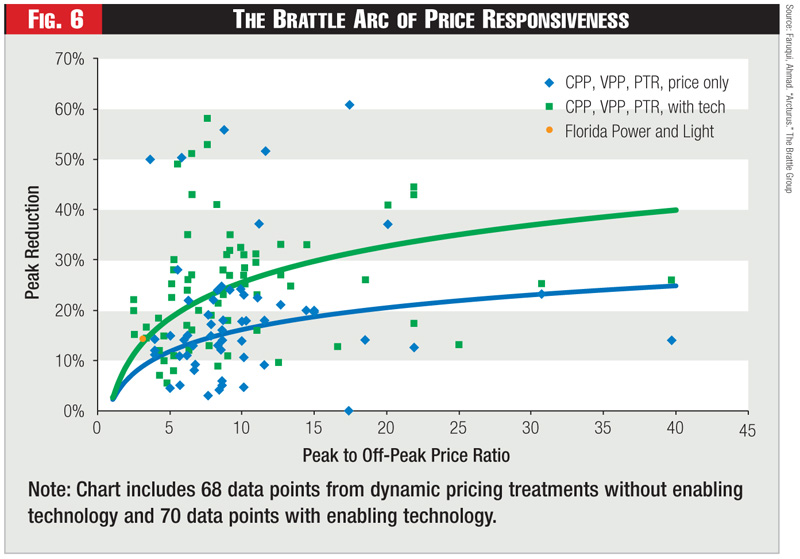
Figure Six shows the impacts of 138 pilot treatments with dynamic pricing treatments, including Variable Peak Pricing (VPP) and Peak Time Rebates (PTR) as well as CPP. Impacts are separated by whether or not they included enabling technologies, and are plotted against the peak to off-peak price ratio.
These results are compiled in Arcturus, a database that we maintain to track the results of dynamic pricing pilots from around the globe. FPL’s CPP tariff had a peak-to-off-peak price ratio of about 3.2.
As seen in the chart, the results are almost exactly in line with the Arcturus impact for a pilot with enabling technology. It should be noted, however, that this result is driven largely by the impacts from two winter events. The non-winter impacts are lower than those observed in other pilots.
See Figure Six.
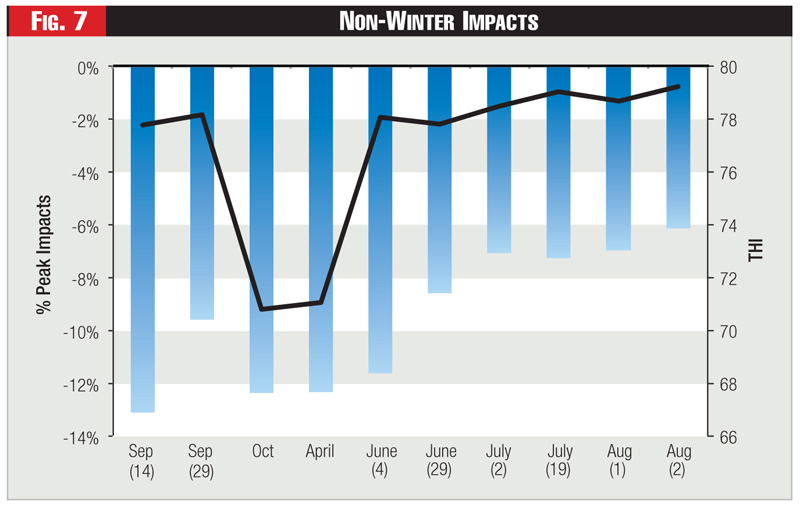
Examining the non-winter impacts in more detail, it is clear from Figure Six that the first five non-winter events had a larger impact than the final five.
We can hypothesize several possible reasons why this may be the case: weather; equipment failure increased over time; increased ability to override equipment over time as customers learn how to do so; treatment fatigue.
With only ten events, we cannot conclusively examine what factors caused the reduction in impacts. However, the data is suggestive of possible causes.
Figure Seven shows non-winter load impacts plotted as blue bars on the left y-axis, while THI is plotted as a grey line on the right y-axis. The first five events are cooler in temperature than the last five, although this difference is not statistically significant in a mean comparison test between both groups of events.
See Figure Seven.
Conclusions
Applying regression analysis to data from a scientifically designed pilot in Florida, we find that customers in a hot and humid climate can and do respond to dynamic pricing. These customers shift load but do not appear to be engaging in energy-conserving behavior.
In terms of load shifting, we find that on critical peak event days, customers reduced their peak period usage by approximately 0.42 kilowatts, or 14.5 percent compared to what they would have used otherwise.
Reductions during winter event days were twice as large as those on non-winter event days (0.71 kilowatts versus 0.36 kilowatts). We also find that the impact was significantly larger for the first five non-winter events than the final five. This was likely the result of failures in the experimental technology toward the end of the pilot.
In terms of energy conservation, we find that customers on the standard rate decreased their energy usage by 0.81 percent when provided with information about their energy usage patterns. Customers with home energy controllers increased their energy usage by 0.43 percent.
Customers with home energy controllers and CPP rates decreased their energy usage by 2.84 percent. However, none of these results were statistically distinguishable from zero.
