Customer cost allocations using the Minimum Distribution System method.
Michael T. O’Sheasy is a vice president with Christensen Associates Energy Consulting and a longtime and frequent contributor to Public Utilities Fortnightly, on topics involving cost of service and rate design. Mr. O’Sheasy worked previously at Georgia Power Co., where he was the architect of the company’s Real-Time Pricing and FlatBill programs, the largest programs of their type in the United States.
Joshua Rogers is an Engineering Supervisor II with Gulf Power Company, a Southern Company, and oversees the distribution system for Panama City Beach, Fla. Mr. Rogers is a licensed Professional Engineer in Florida.


The minimum distribution system (MDS) is a method used to determine the percentage of an electric utility's distribution system required to serve customers. It's based on the equipment that is theoretically needed for a customer to simply receive service, regardless of energy consumption. This percentage becomes the customer-cost-related portion for the purpose of calculating cost of service for the distribution plant account, under the cost accounting manual followed by the U.S. Federal Energy Regulatory Commission (FERC). The MDS concept is an accepted methodology throughout the industry and can be found also in the cost allocation manual accepted by NARUC, the National Association of Regulatory Utility Commissioners.
One method to identify the customer percentage is called zero intercept. The zero-intercept method plots the load-carrying ability of distribution equipment versus the equipment's cost.
The objective is to identify the cost of each piece of equipment necessary to provide service to a customer, regardless of their electrical consumption. This hypothetical piece of equipment is theoretically inherent within all the actual distribution customer-related equipment, and does not represent actual stand-alone-sized equipment, since no manufacturer would make equipment incapable of carrying load. If this piece of equipment were able to carry load, it would then be required that this load be removed from the load allocator, since otherwise there would be some double counting via:
- The load's appearance in the load allocator and
- A reflection of customer cost of the piece of equipment in the customer allocator.
A regression analysis of the data will derive the cost of that theoretical piece of equipment with no load-carrying ability - a zero-load piece that would represent the customer-related part of the equipment.
In this paper we focus on how to perform a zero-intercept regression for FERC Account 364 - Poles, Towers, and Fixtures.
The two components necessary for the regression are the cost and the load-carrying ability. For poles, the ability to carry an electrical load means that the pole must support conductors and other equipment that attach the conductor to the pole. Therefore, the electrical load-carrying ability is represented by the physical ability for the pole to endure forces caused by the attached conductors and equipment. These forces, which are applied near the top of an installed pole, create a moment of force against the pole. The industry standard for these forces is the measured ground-line moment. The ground-line moment is a function of the height of a pole. Therefore, a 35-foot pole and a 40-foot pole with the exact same force applied to each at the tip of the pole would endure different ground-line moments.
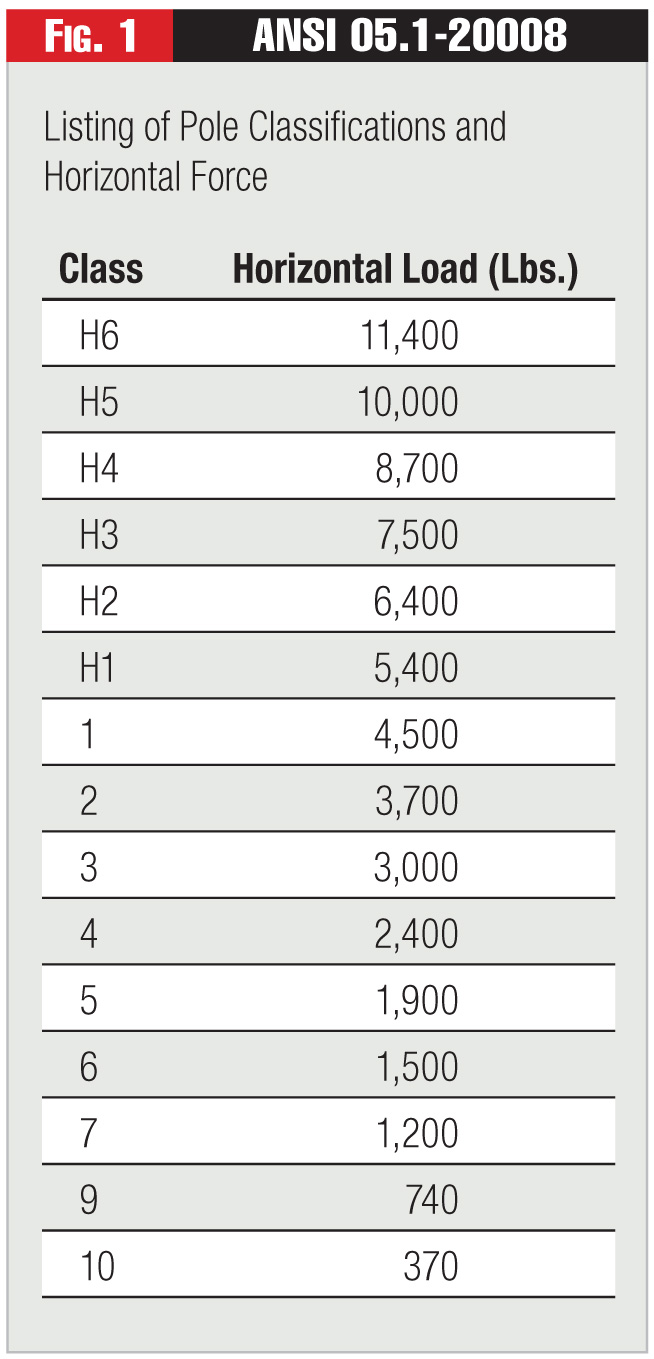
A pole's height is selected based on safety criteria (conductor clearance, ground clearance, terrain, etc.). Therefore, using the ground-line moment of a pole is not necessarily the best indicator to represent the load-carrying ability of the pole (i.e., a 35-foot pole and a 40-foot pole could both have the same equipment on the pole, and therefore the same load-carrying capability, yet the 40-foot pole could have a higher ground-line moment). On the other hand, for all types of poles (wood, concrete, steel, fiberglass), the pole is stamped with its height and a class designation. The class designation of a pole is determined based on the pole's ability to withstand a horizontal force applied two feet from the tip of the pole. This test is representative of the purpose of the pole in the distribution system. Conductors and other attachments are installed toward the top of the pole. The listing of the magnitude of the horizontal force can be found in ANSI 05.1-2008. (See Figure 1)
Determining the class of a pole using the standard, independent of height and material type, will indicate the best load-carrying ability of a pole.
Next, the cost must be determined for poles typically used by the utility. For the zero-intercept regression, replacement cost per pole is one method as opposed to using accounting/embedded cost which may be misleading due to inflation. Typical poles will vary from utility to utility in material, height, and class. Each utility must use their construction standards and specifications to determine what its typical pole is. For secondary distribution, a typical pole may be a 35-foot class 5 pole. For primary single-phase distribution, a typical pole may be a 40-foot class 5 pole. For three-phase primary distribution, a typical pole may be a 45-foot class 3 pole. Accounting and mapping data will be helpful in determining the composition of the distribution system. Recent supply chain pole orders and construction installations might be useful as well in determining what is currently installed and in what quantities. Once the typical pole installations are determined, the pole costs can be grouped by pole class and an average pole class cost can be calculated. Figure 3 shows an example of how to develop the average replacement unit cost.
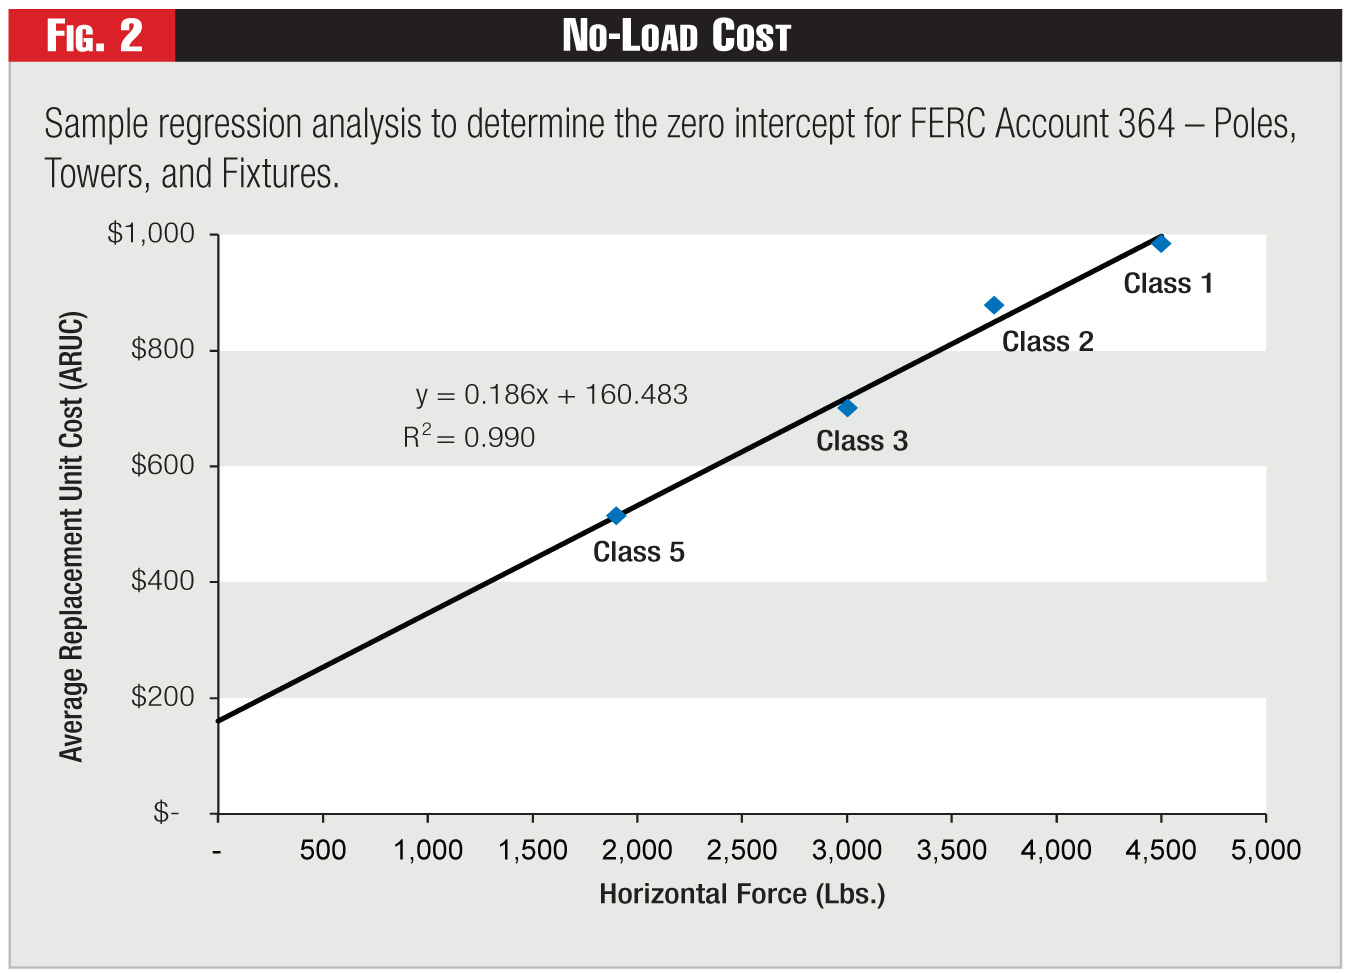
After the pole cost by class has been determined, one is ready to plot the data points and perform the regression. A sample plot can be found in Figure 2.
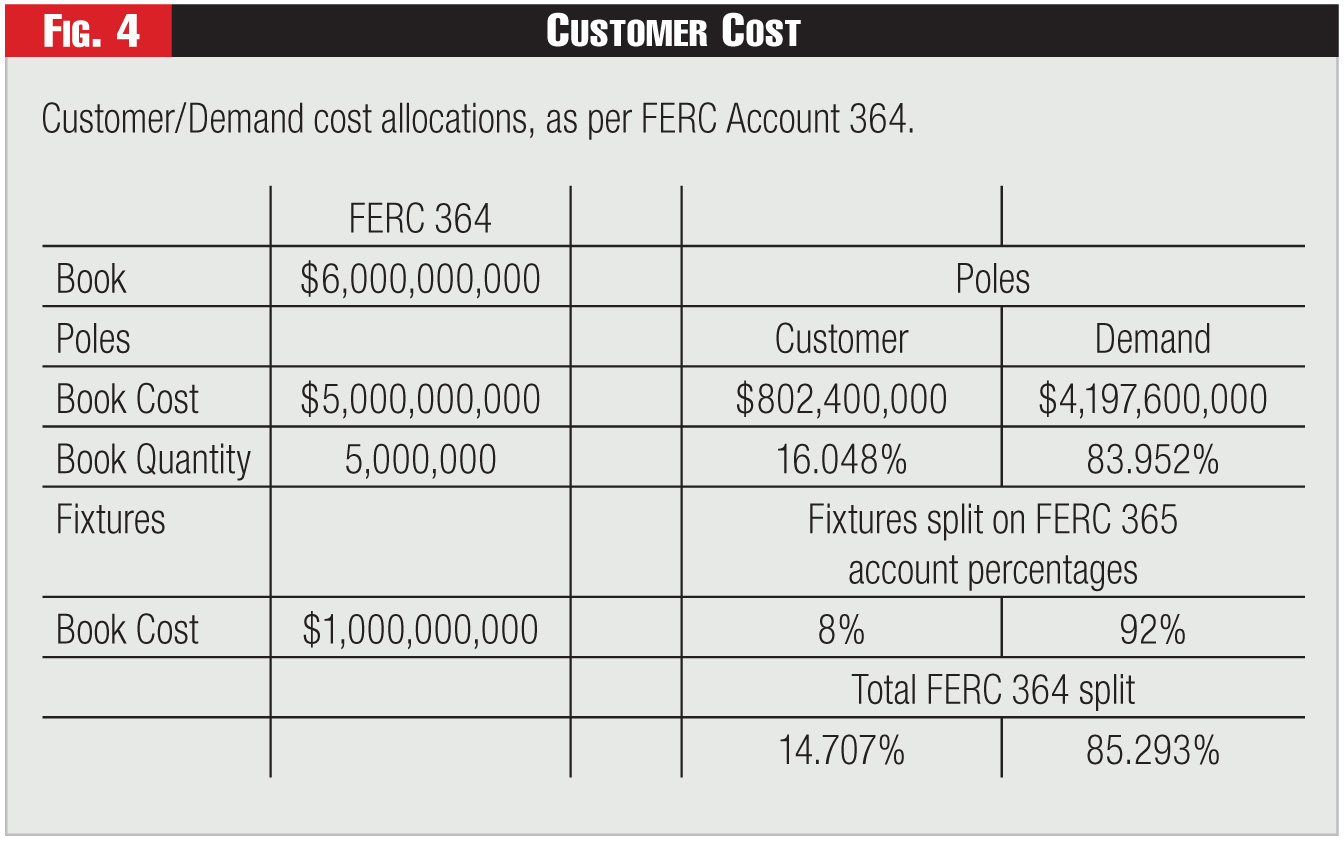
Once the zero intercept is found ($160.48), the next step is to determine the customer- and demand-percentages in the FERC account. The total dollars in the account should be separated into pole investment and fixture investment. Since we used replacement cost to determine the pole costs by class and the zero intercept value, the pole investment using embedded cost needs to be adjusted for vintage in order to develop total replacement cost of poles. Once embedded pole cost is adjusted to reflect replacement cost, the next step is to multiply the numbers of poles in the account by the zero intercept ($160.48 times the number of poles in FERC Account 364), and then to divide by the replacement cost of poles. This calculation yields the customer portion of the pole investment. The residual is the demand portion. Dividing each portion by the total will give the percentage splits for customer and demand.
Now that the customer portion of the poles has been established, the remaining investment in FERC 364 is the fixtures. The fixture investment is independent of the pole investment and the size of the pole the fixture is attached to. Fixtures are sized based on what is being attached to the pole. Therefore, the conductor being attached to the pole drives what fixture is used and not the pole size. The best allocation method for fixtures is the customer and demand splits that are established in FERC Account 365 - Overhead Conductors. Figure 4 shows how the customer and demand split is different for the poles, fixtures, and total account.
Category (Actual):
