Steven Nadel is Executive Director and Rachel Young is a Research Analyst at the American Council for an Energy-Efficient Economy (ACEEE). This article updates and summarizes a previous ACEEE White Paper on this topic.
Electricity consumption has essentially stopped growing in the past few years. Retail electricity sales in 2013 were 1.9% lower than sales in 2007, the peak year. Some observers have attributed this stalled growth to the 2008 economic recession, while others have suggested a variety of other factors. In this paper we consider which factors best explain changes in electricity use in recent years.
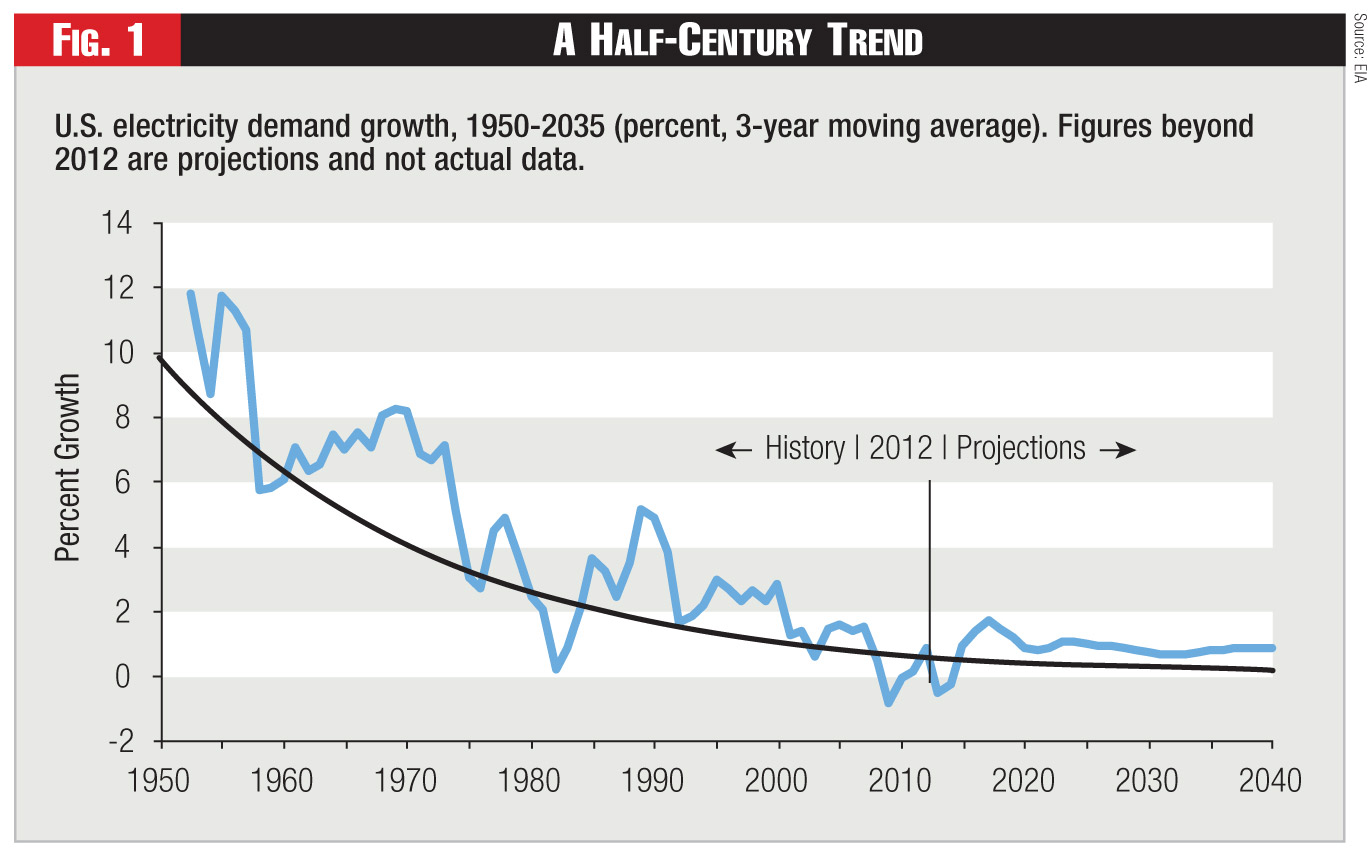
The rate of electricity demand growth in the United States has declined steadily over the last 50 years. Prior to the 1970s energy crises, U.S. electricity sales were growing by more than 5% per year. As recently as the early 1990s, growth was more than 2% per year. Figure 1 illustrates these trends along with Energy Information Administration (EIA) projections going forward.
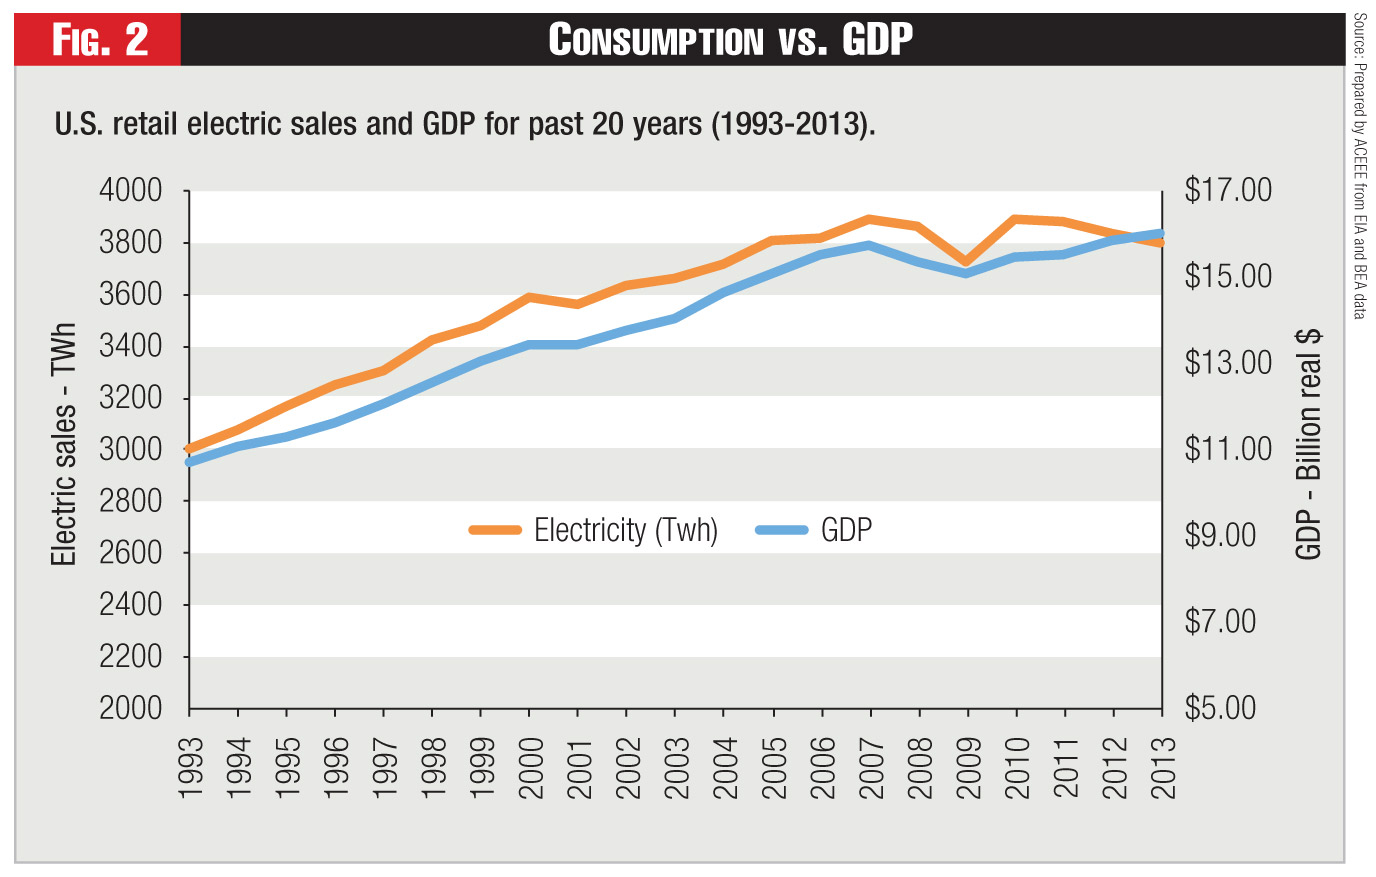
In the past few years, electricity growth has essentially stopped. As Figure 2 shows, electricity sales peaked in 2007, declined significantly in 2008 and 2009 (the recession is likely an important factor), rebounded in 2010, and have trended downward since. In 2014, due to the cold winter electricity sales were up substantially relative to 2013 in the first quarter but level with 2013 in the second quarter.
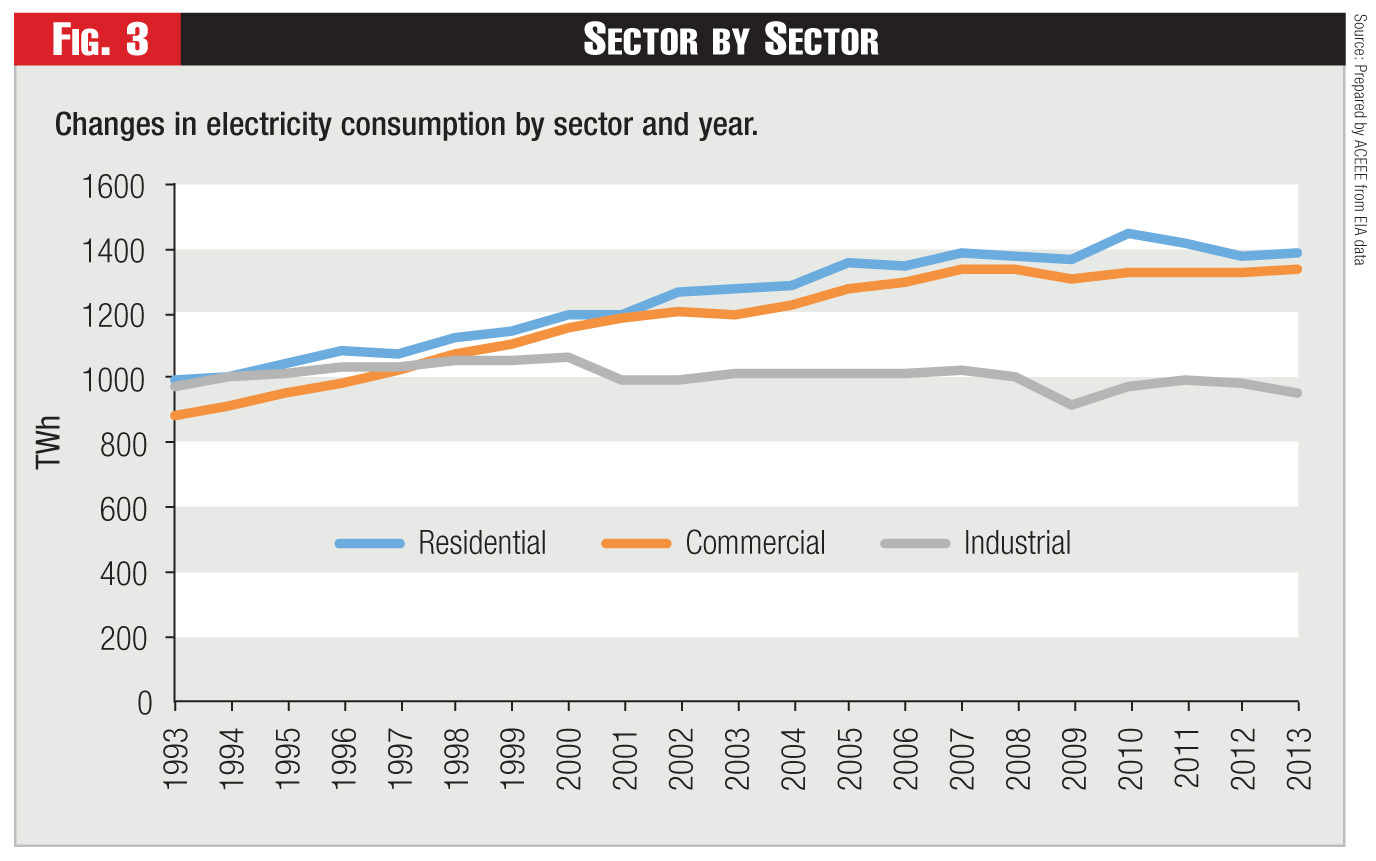
Looking at the trends by sector, Figure 3 below shows changes in electricity use in the residential, commercial, and industrial sectors over the 1990-2013 period. Residential use peaked in 2010, commercial and industrial use both peaked in 2007. Residential consumption in 2013 was 3.8% below 2010 levels. Industrial consumption was 7.1% lower in 2013 than in 2007. Only commercial consumption has rebounded, with 2013 use 0.2% above 2007 levels.
In the 1980s, the Committee on Electricity in Economic Growth found that "there has been a strong correlation between the use of electricity and the size of the gross national product." and also that "there is a strong connection between electricity and productivity growth" This correlation changed in the last few years (see Figure 1). A key question is whether the last few years are an aberration or a long term trend.
In the past couple of years, several writers have noted the lack of demand growth and speculated on reasons for the change. For example, Faruqui and Shultz, writing in this journal (see, Demand Growth and the New Normal, Public Utilities Fortnightly, December 2012), posited five explanations for low demand growth: a weak economy, utility demand-side management efforts, building codes and equipment efficiency standards, distributed generation, and fuel switching. None of these recent writers has tried to examine data on which factors are most important and why, nor have they examined the various possible contributing factors in detail.
In this paper we examine trend data for a variety of potential explanatory factors and also report the results of a preliminary statistical analysis.
Trend Data
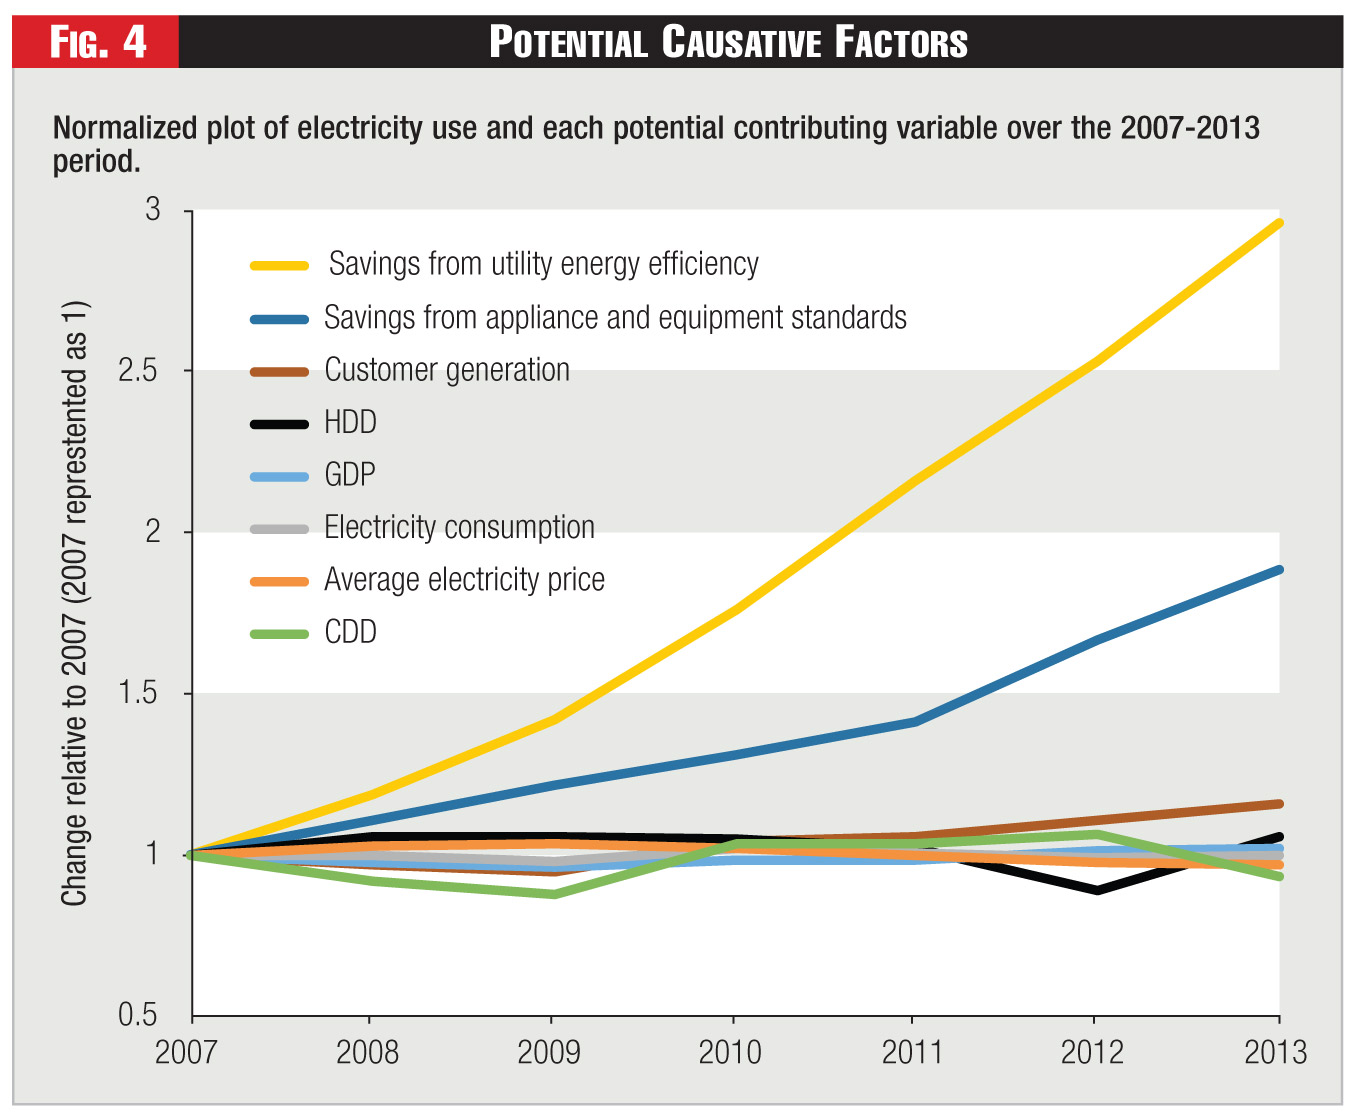
To get a handle on which changes might be substantial, Figure 4 plots changes in electricity per capita relative to per capita changes in several other key variables:
1. Gross domestic product
2. Average real electricity price (in constant $, excluding the effects of inflation),
3. Savings from utility-sector energy efficiency programs
4. Savings from equipment efficiency standards
5. Electricity generated by end users (residential, commercial and industrial sectors),
6. Cooling degree days (CDD) (a measure of weather that triggers a need for space cooling)
7. Heating degree days (HDD) (a measure of weather that triggers a need for space heating).
This figure plots changes in electricity use and each of these variables over the 2007-2013 period, normalizing the data so that the 2007 value for each variable is set to 1 and the relative change for each variable relative to 2007 is shown by a value above or below 1 (e.g., 1.2 or 0.9).
Figure 4 shows a dramatic rise in energy efficiency savings since 2007, both from utility programs and appliance efficiency standards. Customer generation grows in the past three years. Heating and cooling degree days also change from year to year (note - these plots do not show the cold winter in early 2014). The other variables change by modest amounts over this period.
Given the potential significance of energy efficiency savings, we looked further into these data. Over the 2007-2013 period, electricity consumption in the U.S. declined by 1.9%, an average of 0.32% per year. Population grew by an average of 0.81% per year, while electricity use per capita declined by 0.80% per year. According to data from the Lawrence Berkeley National Lab (LBL), incremental annual savings from energy efficiency standards averaged 0.62% per year over this period. Incremental annual savings from utility energy efficiency programs averaged 0.40% per year according to our data set. A 2012 analysis by LBL staff of residential building codes over the 1970-2006 period and published in The Energy Journal estimated that these codes reduced electricity use by about 0.1% per year. This study did not examine commercial building codes, but based on our own analyses, savings from commercial codes are similar to and often a little higher than savings from residential codes.
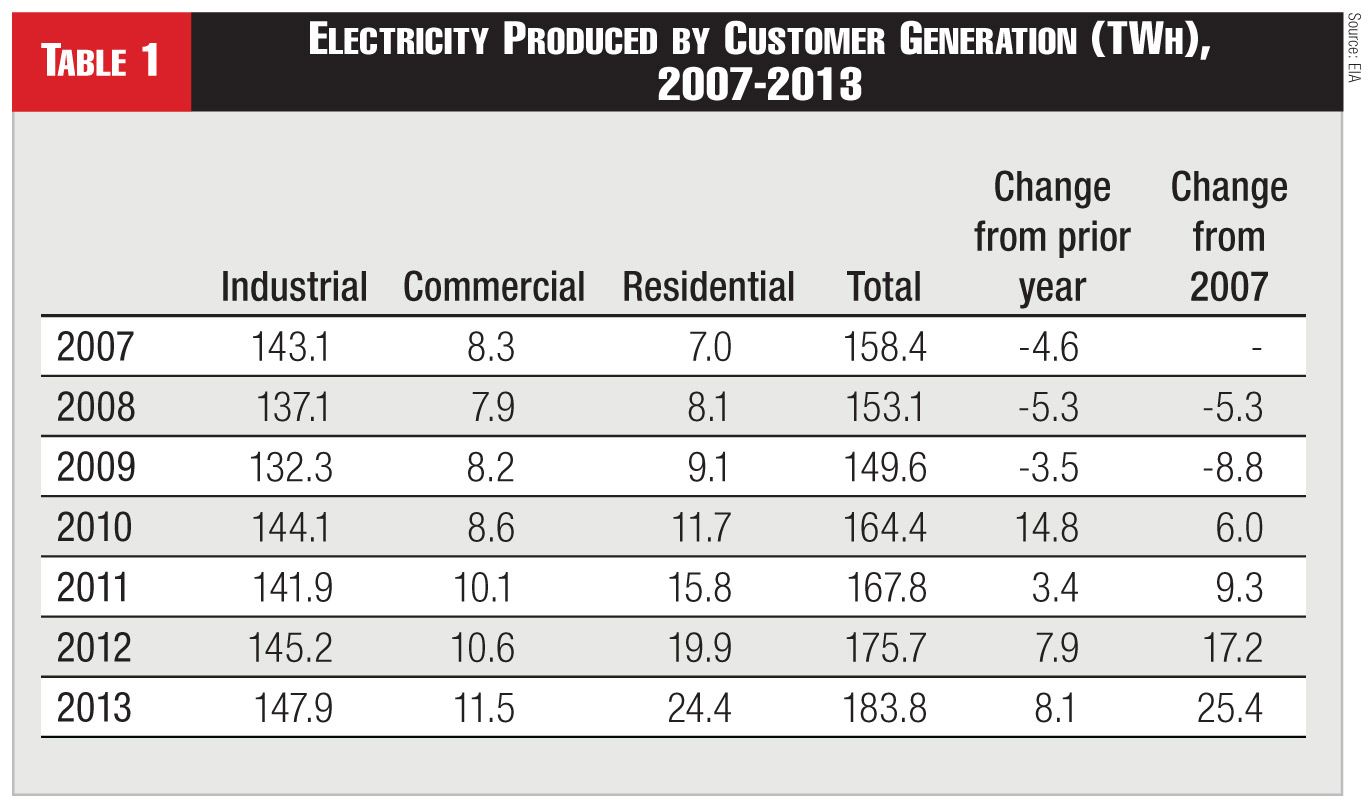
In addition, the increase in distributed electricity generation in the residential, commercial, and industrial sectors over the 2007-2013 period has averaged about 0.11% per year. Nearly two-thirds of this increase was in 2012 and 2013, with the increase in customer generation accounting for about 0.2% of electricity sales in 2012 and 2013. Electricity generation in the residential sector has been steadily increasing, generation in the commercial sector has been increasing modestly, and industrial generation goes up and down (see Table 1). The impact of customer generation (0.2% of sales in recent years) is much smaller than the impact of energy efficiency (about 1% per year), but given the rapid growth in residential generation in recent years, customer generation may have an increasing affect on electricity sales in future years.
Taken together, the savings from utility energy efficiency programs (about 0.4% per year), appliance and equipment efficiency standards (0. 6% per year), and building codes (0.2% per year) total about 1.2% per year. This figure is greater than the decline in electricity use per capita and more than explains the 0.32% per year decline in electricity sales. Changes in other factors could have offset some of these effects. For example, modest increases in manufacturing GDP, modest decreases in industrial electricity price, cooler winters and warmer summers all contributed to slightly higher electricity use, offsetting a portion of the energy efficiency savings. This summation is approximate and should not be viewed as definitive; each of these estimates is subject to substantial uncertainty.
Statistical Analysis
In order to better gauge the relative impact of the different factors discussed in the sections above, we conducted an initial statistical analysis, drawing on national data over the 1993-2013 period, to try to tease out the relative impact of the economy, weather, energy efficiency programs, and other factors on electricity use. We are not statisticians or econometricians, so this analysis should be considered preliminary; we leave it to researchers with more skills in these areas to conduct more definitive analyses. Details of the analysis are described in a paper listed at the end of this article. Separate equations were prepared for residential/commercial and industrial electricity use. Overall, the equations explained 58% of the variance in residential/commercial electricity use per capita and 76% of the variance in industrial electricity use.
For the residential/commercial analysis, four explanatory variables were statistically significant with a 95% probability: cooling degree days, heating degree days, non-manufacturing GDP, and energy efficiency savings. Electricity price was not statistically significant as there was little change in the real residential/commercial electricity price over this period.
For the industrial analysis, manufacturing GDP and non-oil imports and a constant term were statistically with 95% confidence while price was significant with 90% confidence. Energy efficiency savings from utility programs and equipment efficiency standards were modest and were not statistically significant. There is no good source of data customer efficiency investments outside of utility programs and therefore these investments could not be included in the analysis.
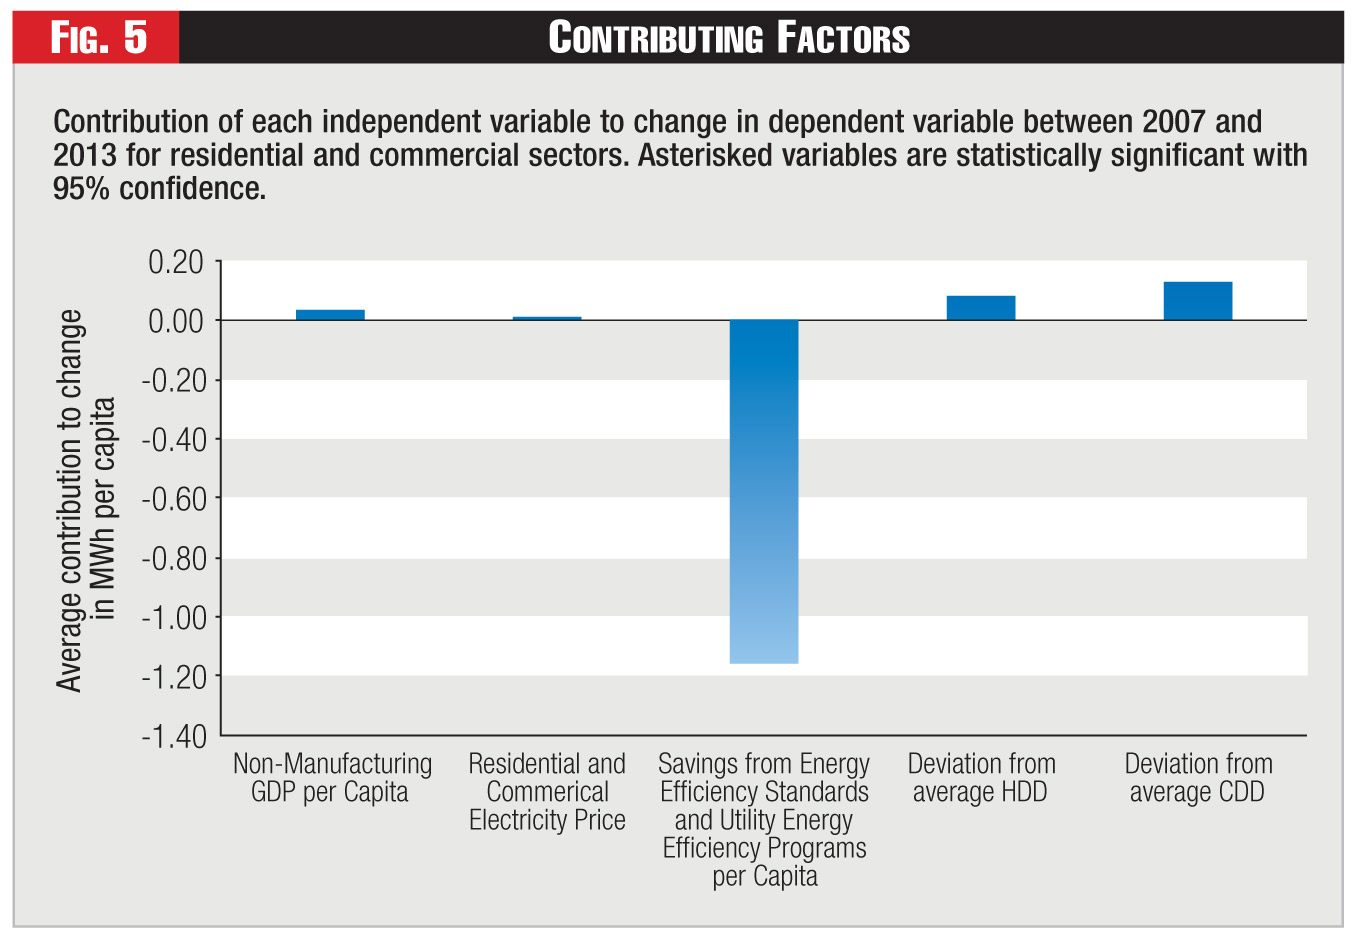
Figure 5 looks at contributors to the decline in residential and commercial electricity use in recent years, applying the results of the regression analysis to each year of the 2007-2013 period and then averaging the annual results. This figure shows the large impact of savings from energy efficiency standards and utility energy efficiency programs over this period. The analysis period did not include the very cold weather in winter 2014 as the analysis is based on full-year data.
For the industrial analysis we have not yet revised this analysis to include 2013. An earlier analysis covering 2007-2012 found that the biggest impact on industrial electricity use over the 2007-2012 period was energy efficiency. However, as noted earlier, the energy efficiency coefficient was not statistically significant, and therefore this result is subject to substantial uncertainty. The next largest impact was changes in manufacturing GDP and non-oil imports, which caused industrial sector electricity use to increase over this period since these variables have increased in recent years. Third in impact was the constant term, indicating a steady and long-term decline in electricity use after controlling for the other factors. Electricity price modestly decreased over this period, causing a modest increase in electricity use. GDP plus imports, price, and the constant term were statistically significant.
What the Data Indicate
These various analyses suggest that energy efficiency has likely affected electricity use. Over the 1993-2013 period, changes in electricity use were most influenced by energy efficiency programs and policies, warmer weather, changes in GDP, changes in electricity prices and long-term trends. Given differences between the residential/commercial and industrial sectors and correlations between variables, it is difficult to separate out the exact contribution of each of these individual variables. Our regression analysis only explains about 58-76% of the variance in electricity use, so additional factors are influencing the results. Further work is needed to identify and analyze these variables, and as new variables are added, the results will change somewhat.
Over the more recent period of 2007-2013, savings from energy efficiency programs and policies appear to be the most important contributor to declining electricity use. Over this period, savings from equipment efficiency standards and utility-sector energy efficiency programs have increased substantially, and these effects were statistically significant for the residential/commercial sectors but not for the industrial sector. The other variables we examined, such as GDP, non-energy imports, heating and cooling degree days and electricity prices, have not changed as much. Furthermore (while outside of our regression analysis), the effects of building codes also add to the energy efficiency savings, and customer generation of electricity increased substantially in 2012 and 2013.
Our results are consistent with a recent regression analysis by Afsah and Salcito from the CO2 Scorecard that found that energy efficiency and conservation measures were the primary cause of reduced CO2 emissions in the United States in 2012. These authors estimate that nearly 75% of the decline in emissions was due to reduced energy demand, primarily attributable to energy efficiency but with a helping hand from the mild winter in the first quarter of 2012. The remaining emissions reductions were due to a shift toward natural gas in the electric power sector. Our findings are also broadly consistent with two econometric studies by Horowitz. In a 2007 study he found that over the 1973-2003 period, "those states that have moderate to strong commitment to energy efficiency programs reduce electricity intensity relative to what it would have been with weak program commitment." In a 2012 study he finds that over the 2006-2010 period, energy efficiency programs and policies in California reduced California electricity use by 7.3%.
What About the Future?
The million dollar question is whether these recent trends will continue. On the one hand, energy efficiency programs continue to ramp up. These trends are likely to accelerate if EPA's recently proposed rules for carbon dioxide emissions from existing power plants are finalized in something close to their current form. Under the draft rule published in June of this year, one of the "building blocks" for state emissions reduction targets is end-use efficiency programs, gradually ramping up to 1.5% incremental electricity use reductions annually. On the other hand, if and when the economy clicks into higher gear, it is possible that the relationship between electricity use and economic growth could return to its former pattern. For example, Chad Burne of American Electric Power posited at a recent PJM workshop that electricity use may be more linked to the unemployment rate than GDP. Also, the LBL estimate of savings from equipment efficiency standards is particularly large for 2012 and 2013 due to lamp efficiency standards; they project a slower rate of savings increase the next few years.
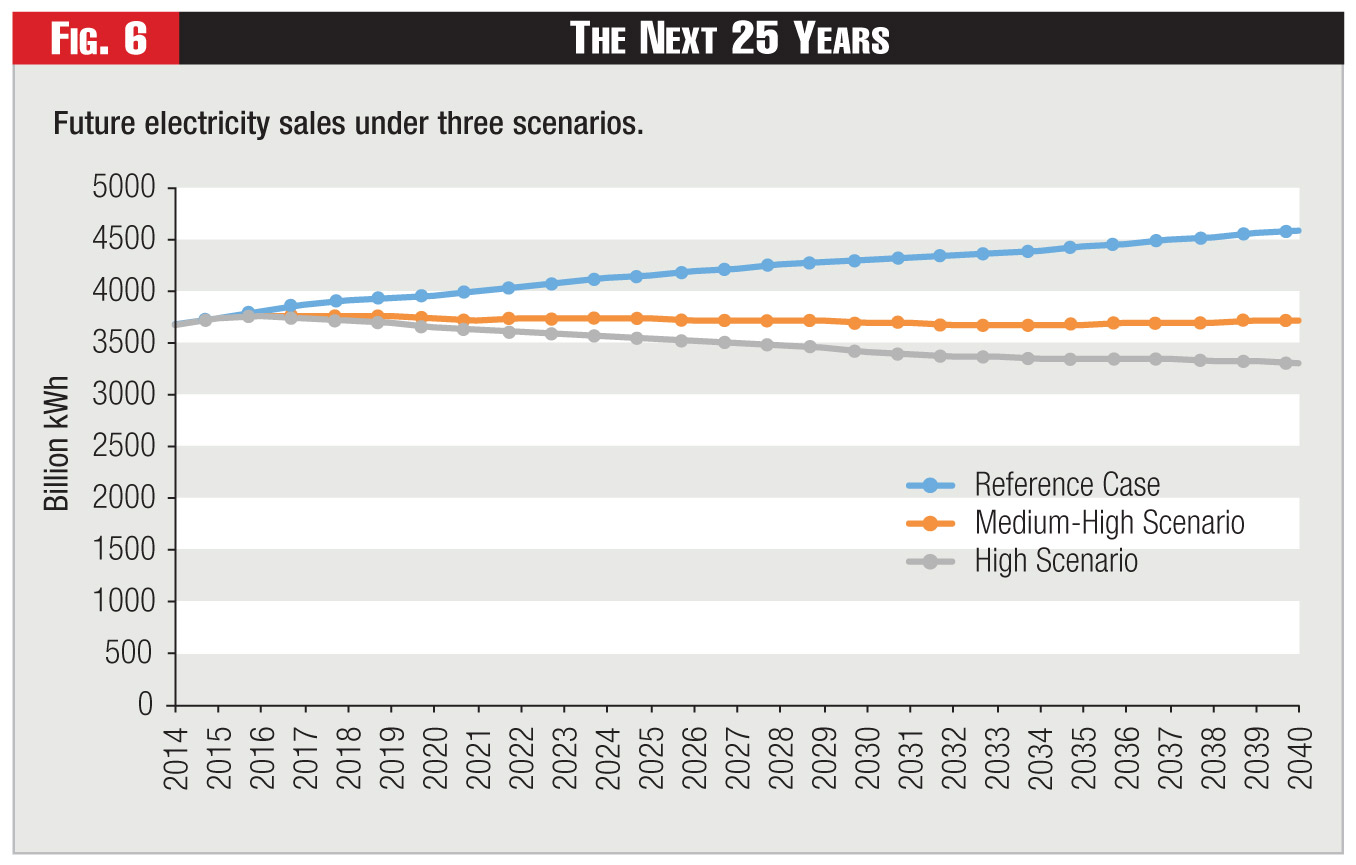
In order to look at a range of possible futures, in a recent study on The Future of the Utility Industry and the Role of Energy Efficiency, we looked at three possible scenarios for future electricity use. In one, labeled the "medium-change" or "reference" case, we used EIA's projections from their 2014 Annual Energy Outlook (early release version). This forecast projects U.S. electricity use will grow an average of 0.7% per year over the 2014-2040 period. The second, scenario, labeled "medium-high change", includes increased energy efficiency (along the lines of the recent EPA proposal) and increased penetration of rooftop photovoltaic systems and electric vehicles, based on a variety of projections by others. Under this scenario, electricity sales are flat through to 2040. The third scenario, labeled "high change" includes even more aggressive implementation of energy efficiency, photovoltaics and electric vehicles, using very aggressive assumptions, such as assuming photovoltaics saturate available roof area in some regions. Under this scenario, electricity sales decline 0.4% per year over the forecast horizon. These results are shown in figure 6. This analysis also looked separately at 20 regions of the U.S., and results varied somewhat between regions. For example, in the most aggressive scenario, regional results varied between a 1.3% annual decline in sales to a 0.3% annual increase. This range of sales forecasts suggests two findings. First, even the most extreme case - a decline of 1.3% per year in one region - is far from the "death spiral" that some observers have postulated. Second, sales are likely to grow less in the future than they have in the past, and therefore, utilities will need to adjust their business plans accordingly.
This set of analyses suggests that increased energy efficiency is likely a major contributor to decreased electricity growth rates over the 2007-2013 period. Further analysis is needed to better understand the contribution of energy efficiency as opposed to economic and other factors, particularly in the industrial sector where energy efficiency data are less complete and GDP and electricity use trends have recently diverged. Also, for all sectors, it will be useful to repeat the analysis in a few years to see if the recent decline in electricity use and the contribution of energy efficiency to this decline continue, or if the last few years have merely been an aberration in long-term trends. Future trends for electricity sales are highly uncertain, but reasonable predictions range from modest growth to modest decline, with level sales on a national basis the most likely estimate.
Category (Actual):
